Research Note · Equal-Weight Nasdaq Giants, Trend-Gated

AlphaStrat 5.0

Own the five biggest companies on the Nasdaq, in equal parts, while the market's year-long trend points up. When it doesn't, own Treasury bills and wait. No leverage, no forecasts, about seven trades a year. That is the whole strategy — and unlike most notes of this kind, we're going to start with the flaw we haven't fixed yet.

Author: Brent Wood Published: July 2026 Status: Research — not locked

Cleanest supported replay*

22.6%

2010-01-04 → 2026-05-22; in-sample, not locked

Honest Forward Guess

low double digits

not the 17% — see below

Exploratory after-tax (33%)

16.2%

same survivor-limited path*

Worst decline

−52.4%

current replay; gaps remain*

Start with the ghosts

Every backtest of a strategy like this has a graveyard problem, and ours isn't fully solved yet, so you're going to hear about it first. The rule buys the five biggest Nasdaq companies. In 1999, some of the biggest Nasdaq companies were WorldCom, Sun Microsystems, and Yahoo — names that later went to zero or nearly so. Our data vendor has no price history for the dead: their tickers were literally handed to other companies. So the early decades of our backtest hold only the companies that survived, which means the rule, as tested, never buys WorldCom in 2000 and never rides it down. That's not a small technicality. It flatters the early numbers, and it flatters them upward, in exactly the crash years where this strategy would have been tested hardest.

We've built the machinery to put the ghosts back in — a curated file of the dead giants, their prices reconstructed from regulatory filings — but the curation is slow, manual work and it isn't done. Until it is, every number in this note from before roughly 2010 should be read as an optimistic ceiling, not a result, and we've marked them with an asterisk. We'd rather publish the flaw than hide it in a footnote. When the graveyard data lands, we'll re-run everything and update this note, whichever direction the numbers move.
The Rule

Old man's version: buy the five biggest fish in the Nasdaq pond, same-sized helpings of each, as long as the pond is rising. When the pond is falling, get out of the water entirely and collect interest until it rises again.

Every two months —

Question 1 — Should I be in at all? Is the Nasdaq-100 higher than it was twelve months ago? Yes → own stocks. No → own T-bills, all of it, full stop.

Question 2 — Which stocks? The five biggest Nasdaq companies by market value, one-fifth of the money in each. If a holding has drifted less than 20% from its target, leave it alone — don't fiddle.

That leave-it-alone clause matters more than it looks. Without it, the rule fusses with the portfolio thirty-odd times a year, trimming a little Microsoft here to buy a little Apple there, accomplishing almost nothing except commissions and paperwork. With it, the whole operation is about seven trades a year. Five stocks, a T-bill fund, and a calendar. Any brokerage account can hold it; there's nothing exotic anywhere in it.

What we deliberately left out: leverage

Our sibling strategy, AlphaStrat 2.1, takes a similar trend idea and runs it with three-to-one leverage through a leveraged fund. It backtests at a higher return, and it comes with everything leverage brings: borrowing costs, the daily grind of leveraged funds, and losses that arrive multiplied. This strategy is the unlevered cousin. You own five actual companies and a pile of T-bills — no borrowed money, nothing that can be taken away from you at the bottom of a panic. What you give up in headline return you get back in the ability to hold the thing through a bad decade, which — as we never tire of saying — is where most of the real-world return goes to die.

Why the biggest five, and not the best five?

Because "best" requires judgment, and judgment is where systematic strategies go to rot. "Biggest" is a fact. It requires no opinion, no forecast, no committee. The market has already voted, with trillions of dollars, on which technology franchises are winning; we're simply accepting the vote and adding one discipline the index doesn't have — the willingness to leave entirely when the trend breaks. The honest cost of that simplicity: we will always own yesterday's winners, never tomorrow's. More on that soft spot below.

The Scorecard

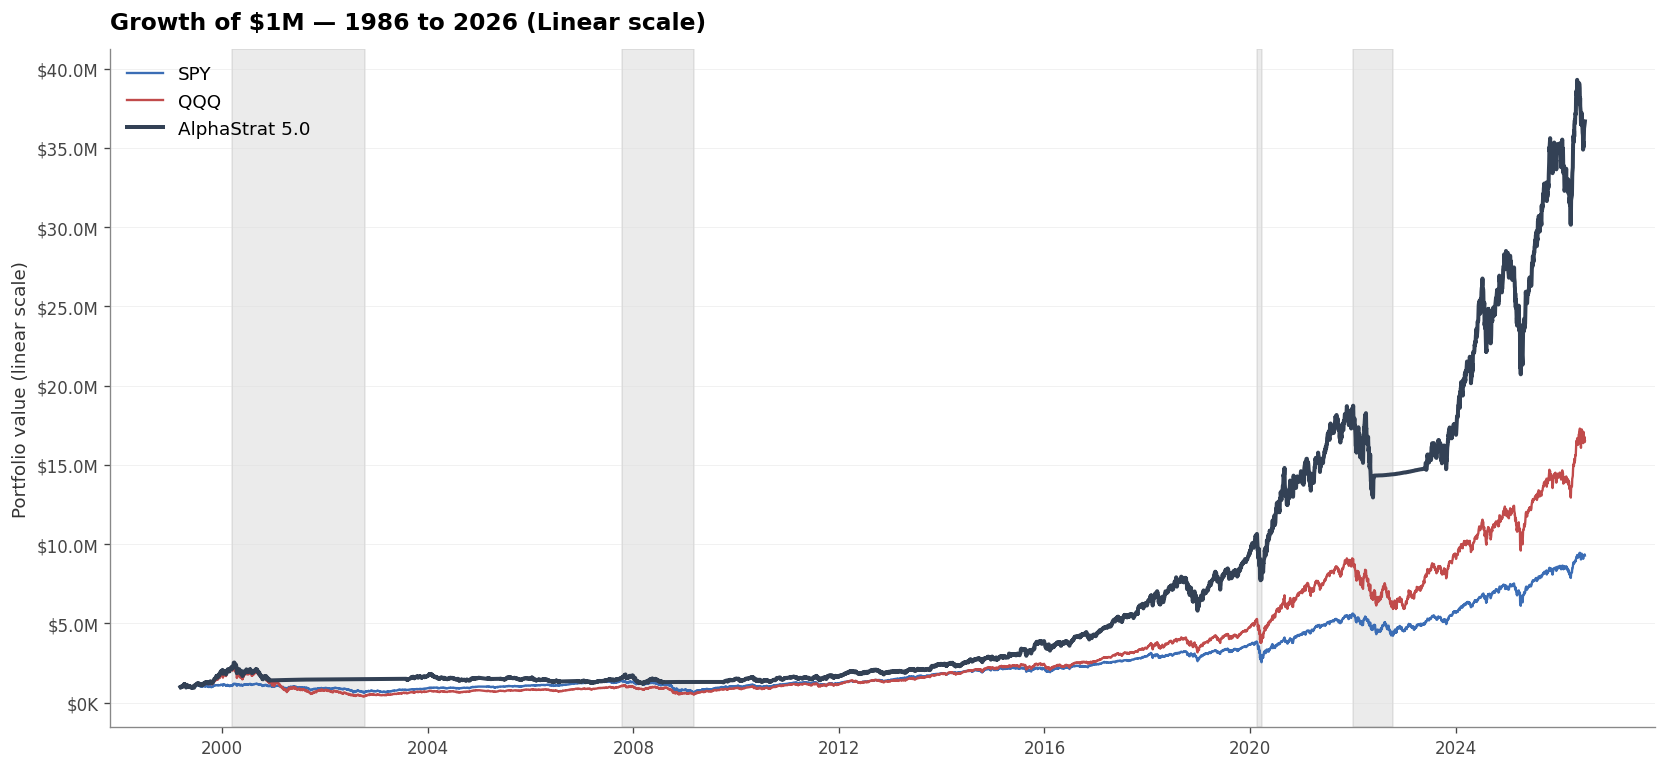
Common availability window 1999-03-10 → 2026-07-08: $1M grew to about $36.7M — a 14.1% CAGR with max drawdown about −52.4%. The ETF comparison is apples-to-apples, but the path remains survivor-limited before 2010. The separate 1986-02-03 → 2026-07-08 path is exploratory, not validated.

Chart Scale:
AlphaStrat 5.0 Growth of One Million Chart
Figure 1: Growth of $1,000,000 (common window with SPY/QQQ). AlphaStrat 5.0 plotted against SPY and QQQ. Gray bands mark major crisis windows. Pre-2010 path is survivorship-flattered — see “Start with the ghosts.”
Metric AlphaStrat 5.0 SPY (S&P 500) QQQ (Nasdaq-100)
CAGR (27.3y) 14.09%* 8.49% 10.80%
Total Return +3,567%* +828% +1,549%
Maximum Drawdown -52.4% -55.2% -83.0%
Sharpe Ratio 0.71 0.52 0.52
$1M → Final Value $36.67M* $9.28M $16.49M

The exploratory simulation (1986-02-03 → 2026-07-08)

The strict replay that currently passes data checks begins 2010-01-04 and runs through 2026-05-22: about 16.4 years, with a provisional 22.6% CAGR*. It is still in-sample because this configuration was selected from the same historical sweep, so it is evidence of a research candidate — not a forecast.

The database can also replay 40.4 calendar years from 1986-02-03 through 2026-07-08. That makes 17.4%* an exploratory simulation figure, not a validated backtest: the dead-company backfill is still missing, the early universe is incomplete, and strict target-bar verification blocks a clean full-window rerun.

Metric AlphaStrat 5.0 Status
2010–2026 CAGR*22.6%Strict replay; in-sample
1986–2026 CAGR*17.4%Exploratory; not validated
Worst decline*−52.4%Data gaps remain
Trades per year6.5Strict rerun blocked
Cleanest supported span16.4 years2010-01-04 → 2026-05-22
Exploratory span40.4 years1986-02-03 → 2026-07-08

The most honest table we have is this one

Split the exploratory span into three eras and the 17% falls apart into something much more instructive:

EraCompound rateWhat was happening
1986–1998~24%*PC and internet build-out — and the era most flattered by the ghosts
1999–2012~6%*Dot-com bust and financial crisis — and the true number is worse, because the ghosts are missing
2013–2026~24%The mega-cap decade — the cleanest data, and the friendliest possible regime

Read that middle row twice. For fourteen straight years — years with honest-to-God crashes in them — this strategy compounded at roughly the rate of a savings bond, and the real figure, with the dead names restored, would have been lower still. Anyone who starts this strategy at the wrong moment should expect that decade is possible again. The bottom row is what everyone will remember and the middle row is what everyone should study.

The pleasant surprise: taxes

We expected the taxman to be this strategy's undoing — anything that re-ranks its holdings every two months sounds like a machine for generating short-term gains. The illustrative tax overlay on the same survivor-limited path suggests almost every dollar of modeled gain comes out long-term, but it is not a complete tax simulation.

The reason is simple once you see it. The five biggest Nasdaq companies barely change from one re-ranking to the next — Microsoft holds its seat for decades. So positions live for years, and when the rule does trim, the accounting sells the oldest shares first, which have long since crossed the one-year line. The frantic-looking machine is, underneath, a buy-and-hold investor with a strict exit rule.

Tax bracket (LT rate)AlphaStrat 5.0, after taxQQQ B&H, after tax
15%16.9%*10.2%
24%16.6%*9.8%
33%16.2%*9.3%
37%16.0%*9.1%

Total tax drag runs about half a point to a point and a quarter a year, depending on your bracket. Unlike its leveraged sibling — which we'd only hold in a retirement account — this one can live in an ordinary taxable brokerage account without the taxman eating the edge. The asterisk still applies to the levels; the tax structure of the result doesn't depend on the ghosts.

Why we say "low double digits," not seventeen

Three honest discounts, stacked:

The ghosts, again. The backtest's early decades are missing the dead, and dead companies only ever push a number one way. Take the 17% as a ceiling before you apply any other discount.

The bottom row of that era table is doing the heavy lifting. The roughly 24%-a-year 2013–2026 stretch was the single most concentration-friendly market in modern history — a decade in which the five biggest tech companies got relentlessly bigger. Starting today, with the Nasdaq more top-heavy than it has ever been, this strategy is a bet that the big get bigger still. If concentration merely stops increasing, this rule likely trails the index while paying more in trading friction. If it reverses, that middle-row decade comes back.

Sixteen years is enough to keep researching, not enough to declare victory. The cleanest window misses the dot-com collapse and most of the financial crisis, and these settings are the best of 1,600 combinations tested against the same history. A strategy tuned on the past always flatters itself; the honest adjustment is to assume the winner's margin was partly luck.

Stack the three and we'd plan around low double digits — call it 10 to 14 — with a wide band, and we'd hold the after-tax comparison as the more defensible claim: whatever the Nasdaq does from here, this rule has kept most of it, paid long-term rates on it, and skipped a healthy share of the catastrophes.

The one thing it can't dodge

By construction, this strategy buys companies after they've become enormous. It will never own the next great company early; it will always own the last great company late. In a market where leadership holds — the last decade — that costs nothing and pays wonderfully. In a market where leadership rotates — 2000 to 2012 — it's a machine for buying peaks: the rule bought the biggest names of the bubble at their most swollen and rode the churn down to a savings-bond return. The trend gate softens this — it moved the whole portfolio to T-bills for long stretches of those years — but a gate that looks back twelve months is deliberately slow, and slow protection is partial protection.

There is no fix for this that doesn't break the strategy — pick "better" companies and you've replaced a fact with an opinion. It's the price of the simplicity, and the defense is the same one we always give: size the thing so the bad decade is an annoyance, not a catastrophe.

Who this is for — and who it isn't

This is the most holdable strategy we've published: no leverage, five household-name stocks, a T-bill fund, and seven trades a year. That makes it dangerous in a different way — it looks tame. A few plain rules we'd hold ourselves to:

Taxable accounts are fine. The gains come out long-term; the taxman takes his cut but not the edge. That's rare for a systematic strategy and it's this one's quiet superpower.

It concentrates. Respect that. Five stocks is not a diversified portfolio; it's a focused bet on continued mega-cap leadership with an exit rule attached. A sleeve, not the whole book.

Expect the −52.4% shown in the current replay. The gate reduced the crashes; it did not abolish them. If a halving of this sleeve would make you abandon the rule at the bottom, the strategy's real return, for you, is negative.

Remember it isn't locked. This is a research note on a strategy whose early-decade data we are still repairing. The numbers will move when the ghosts go back in. We'll say so when they do.

A few last things you should know before you take any of this too seriously.

Nobody made any of this money. Every number here comes from running the rule against historical prices. No real capital has been at risk. Backtests are stories told in a way that flatters their author, and you should read all of them, including this one, skeptically.

The graveyard is real and it is ours to fix. We enumerated 122 dead companies that were once big enough to matter to this rule and could not obtain their price histories from any commercial source. Restoring them from regulatory filings is in progress. Until then, the pre-2010 figures wear their asterisks honestly.

Live will be messier than this. Real fills, dividend timing, and the small frictions of an actual brokerage account will chip away at the result. The model charges itself trading costs, but models are polite about friction and the world isn't.