Research Note · Trend-Filtered, Volatility-Targeted Nasdaq

AlphaStrat 2.1

We own a leveraged bet on the Nasdaq when the year's trend is pointed up — and nothing but Treasury bills when it isn't. And we size that bet by how rough the seas are: calm water, we lean in; storm, we pull back, automatically, before we're asked. That is the whole strategy. The rest of this note is us telling you, plainly, everything that's wrong with it.

Author: Brent Wood Published: June 2026 Status: Locked

Backtest CAGR (27y)

24.2%

QQQ B&H: 11.0%

Honest Forward Guess

low-to-mid teens

not the 24% — see below

Sharpe Ratio

0.68

QQQ B&H: 0.52

Where it belongs

Tax-deferred, sized small

money you can afford to lose

Start with what's wrong with it

We're going to do this backwards, because the honest parts are the ones people skip. This strategy uses leverage — it can own three dollars of Nasdaq for every one dollar you put in. We don't love leverage. Smart people have gone broke on leverage who would never have gone broke without it. The reason we use it here, and the only reason, is that we pair it with a brake that pumps itself the moment the road gets rough. Take the brake away and the same idea is a catastrophe — held straight through, three-times-leveraged Nasdaq lost about 98 cents on the dollar in the dot-com crash. The whole game is the brake.

Second: the headline says 24% a year. Do not plan on 24% a year. That number is a backtest run over the single most leverage-friendly 27 years in market history, and the honest forward guess is the low-to-mid teens — maybe less. We'll show you exactly why further down. If a person tells you a leveraged strategy will make 24% a year forever, count your fingers after you shake their hand.

Third: leverage cuts both ways. In a bad stretch this loses a real chunk of your money, and it can take years to climb back. If a deep loss would make you sell at the bottom, then for you this strategy has a negative return, because that is exactly when you'd quit. Know thyself before you size this.

Now — having said all that — here is why we built it anyway, and why we think it's a genuinely better mousetrap than its predecessor, AlphaStrat 2.0.
The Rule

Old man's version: own the Nasdaq, with some borrowed help, when it's going up; own T-bills when it's going down; and never carry more sail than the weather allows. It asks two questions, once a month, and that's all it does.

Question 1 — Should I own it at all? Is the Nasdaq higher than it was twelve months ago? Yes → we're allowed in. No → sit in T-bills, full stop.

Question 2 — If so, how much? Look at how violently prices have been jumping around lately. Calm → press the gas, up to 3x. Wild → ease off toward cash. The bumpier it is, the smaller we ride.

That's it. The first question is the direction switch; the second is the throttle. The instrument is TQQQ, a fund that delivers three times the Nasdaq's daily move, paired with a T-bill fund (SGOV or BIL) for the cash. No futures, no margin account, no phone calls. A computer checks the two questions on the first of the month and trades the difference.

Why the throttle is the heart of it

Think of a kid on a scooter going downhill. Smooth sidewalk, he flies. Cracked, bumpy sidewalk, he slows down — because a bump at full speed throws you off, no matter which direction you're pointed. The throttle works the same way: it measures the bumpiness of the market — what the professionals call volatility — and shrinks the bet when things get jumpy. And here is the part that matters: markets get the bumpiest right when they're about to fall apart. So the throttle is already easing off before the crash fully lands. It's a seatbelt that tightens itself the instant the road turns dangerous. Nobody has to predict anything. You just react to the bumps, and the bumps always show up first.

The Scorecard

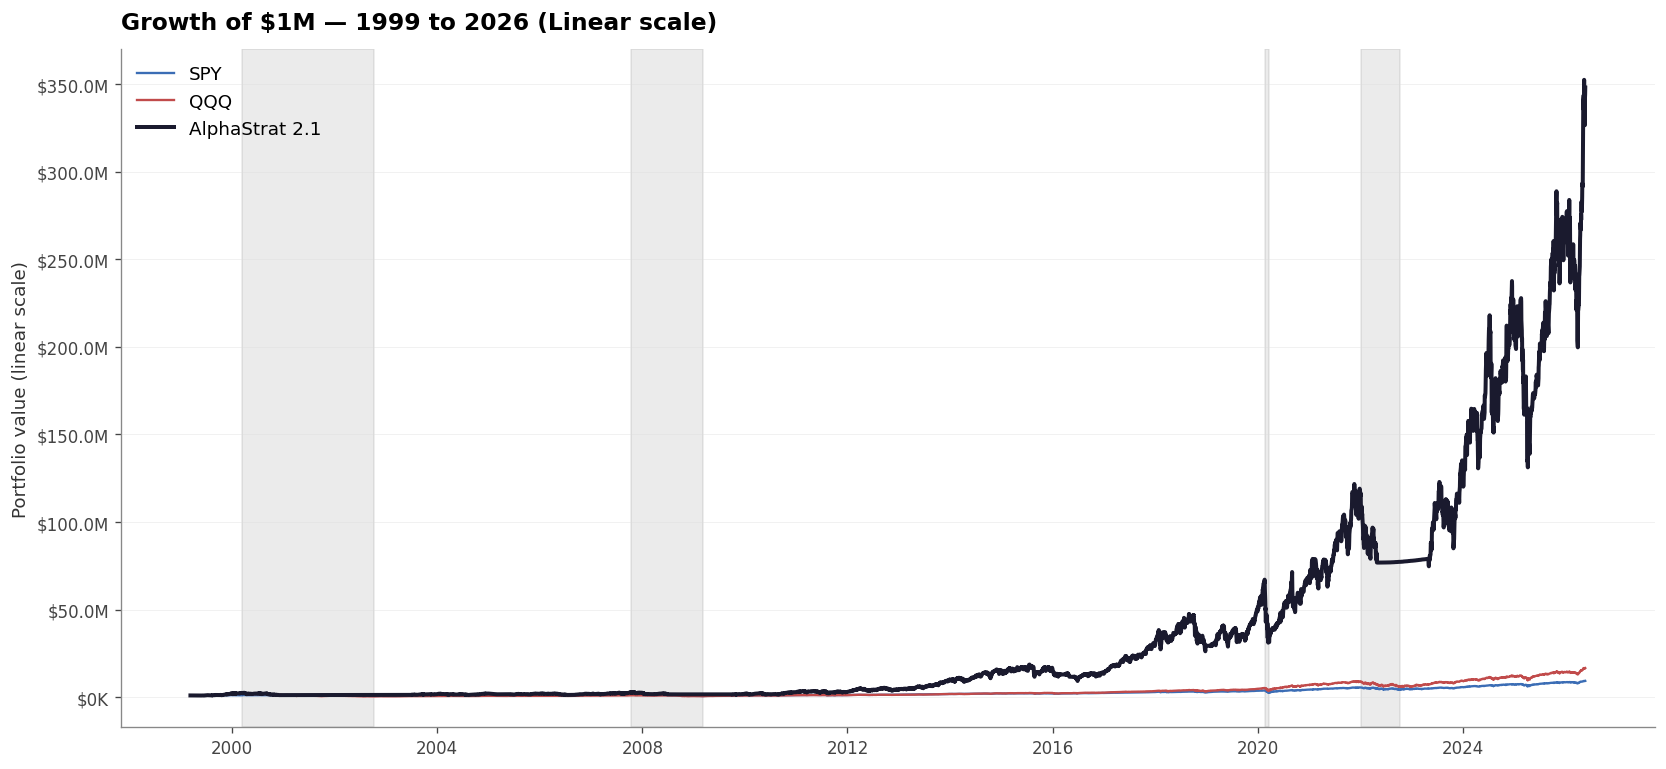
A million dollars handed to these rules in March 1999 — at the top of the dot-com bubble — would have grown to about $348M by May 2026. The same million in SPY would be about $9.3M, and in QQQ about $16.6M. That is a 24.0% CAGR with a maximum drawdown of about −53.6%. Distrust the headline; the rest of this note explains why the honest forward guess is the low-to-mid teens.

Chart Scale:
AlphaStrat 2.1 Growth of One Million Chart
Figure 1: Growth of $1,000,000 (1999 – 2026). AlphaStrat 2.1 plotted against SPY and QQQ buy-and-hold. Gray bands mark the four major crises: dot-com, GFC, COVID, and the 2022 rate-shock bear.
Metric AlphaStrat 2.1 SPY (S&P 500) QQQ (Nasdaq-100)
CAGR (27.2y) 24.01% 8.54% 10.89%
Total Return +34,705% +829% +1,563%
Maximum Drawdown -53.6% -55.2% -83.0%
Sharpe Ratio 0.73 0.52 0.52
$1M → Final Value $348.05M $9.29M $16.63M

The Backtest (1999-03 → 2026-05)

A million dollars handed to the rule in March 1999 — at the very top of the dot-com bubble, the worst possible day to start — would have compounded at about 24% a year. That's a big number, and you should immediately distrust it; we'll dismantle it in a minute. But first, the honest comparison: the same rule beat just-buying-the-Nasdaq (11% a year, and a stomach-turning 83% drawdown) and it beat our own previous strategy, AlphaStrat 2.0, on both return and pain.

Metric (1999-2026) AlphaStrat 2.1 QQQ buy & hold 3x Nasdaq, held straight
CAGR24.2%11.0%~22.8%
Sharpe ratio0.680.520.49

Here's what those numbers hide. Three-times Nasdaq held straight through made almost the same return as our rule — but only by surviving a near-total wipeout in the crashes, the kind that doesn't come back in a working lifetime and that nobody actually holds. The rule earns its keep not by making more, but by making roughly the same while staying survivable. Owning the leverage without owning the ruin — that is the entire point. The throttle and the direction switch are what stand between you and that wipeout.

The most honest chart we have is this table of years

Here's the thing about that 24%: it was made almost entirely in the back half. For the first fourteen years, the rule's compound rate sat in the single digits. An investor who started at the 1999 top spent over a decade — through a brutal early stretch and two years parked in cash watching it earn nothing — before the rate ever crossed into the teens.

By the end of...$1M had becomeCompound rate so far
2002 (dot-com bottom)~$1.2M~5%
2008 (financial crisis)~$1.3M~3%
2012 (year 14)~$3.8M~10%
2019~$34M~19%
2026~$350M~24%

The 24% is real, but it's a number that was mostly made recently. Stop the clock in 2012 and this looks like a perfectly ordinary 10%-a-year idea that occasionally scared you witless. That is the honest shape of it.

Why we say "teens," not "twenties"

Leverage doesn't make money out of thin air. It just takes whatever the Nasdaq's going to do and multiplies it — the good and the bad alike. So the forward question isn't "how clever is the strategy," it's "what's the Nasdaq going to do from here, and what will it cost to borrow." On both counts, the next 27 years have a harder hand to play than the last 27:

It's a Nasdaq bet, not a magic trick. Run the exact same rule on the S&P 500 instead of the Nasdaq and the return roughly halves. Most of the edge was the Nasdaq's own once-in-history tech run, leaned on. Bet that tech leads the world for another quarter-century at your own risk.

Borrowed money used to be free; now it isn't. For a big chunk of the backtest, interest rates were near zero, so the leverage cost almost nothing. Today it costs four or five percent, and you pay that on the borrowed portion every year. That alone takes a few points off the forward number.

One lucky deck of cards. We picked the best settings by looking at one 27-year history. The real world deals a different hand. A strategy tuned on the past always flatters itself a little.

Put those together and we'd plan around the low-to-mid teens, with a wide band around it — and we'd be delighted, not surprised, to be wrong in either direction. The one thing we won't do is pretend the backtest number is a forecast.

The one thing it can't dodge

Every crash in our 27 years was loud — the dot-com bust, 2008, COVID, 2022 all came with violent, scary down-days. Loud crashes are exactly what this strategy is good at: the throttle feels the violence and cuts the leverage, or the price falls hard enough to flip the direction switch. Either way, it gets out.

But imagine a quiet bear market — a slow, calm, grinding decline with no panic and no big down-days. The throttle reads "calm" and stays leaned in. The direction switch, which looks back a full year, takes months to notice. In that one scenario, both of our alarms are slow, and the strategy could be leveraged into a quiet bleed. We went looking for a fast circuit-breaker to patch this, tested five of them honestly, and every single one made the strategy worse — they whipsawed on the loud crashes we actually had while protecting against a quiet one that never came. So we didn't bolt one on. We'd rather tell you the soft spot is there than sell you a fix that doesn't work. The honest defense against it isn't a clever signal — it's owning less of this, so a quiet bear can't hurt you badly.

Who this is for — and who it isn't

This is not a retirement plan and it is not your grocery money. It's a high-octane sleeve for a corner of a portfolio you've already decided you can afford to lose. A few plain rules we'd hold ourselves to:

Tax-deferred only. It trades enough that, in a taxable account, the taxman eats the edge. Put it in an IRA or a 401(k) or leave it alone.

Size it small. A sleeve, not the whole book. The honest defense against a deep loss and the quiet-bear soft spot is the same thing: own less of it.

Only money you can watch take a deep loss — and not sell. If a deep loss would make you quit at the bottom, this strategy will lose you money no matter what the backtest says.

If those rules sound like a wet blanket on a 24% number, good. That's the point. The people who get hurt with things like this are the ones who heard the 24% and skipped everything after it.

A few last things you should know before you take any of this too seriously.

Nobody made any of this money. Every number here comes from running the rule against historical prices. No real capital has been at risk. Backtests are stories told in a way that flatters their author, and you should read all of them, including this one, skeptically.

The pre-2010 years are simulated. The 3x Nasdaq fund (TQQQ) didn't exist until 2010, so the first eleven years of this test use a careful simulation of what it would have done. We checked the simulation against the real fund over 2010-2026 and it matched closely — but it's still a model, not a track record.

Live will be messier than this. Real slippage, the daily mechanics of leveraged funds, borrowing costs, and the way your broker handles things will all chip away at the result. Expect friction the model doesn't fully capture, and plan for it.