Research Note · A Two-Bucket Glidepath

AlphaStrat 2.0

We own two things — the Nasdaq-100 and a parking lot for cash. We draw a line on the wall at 18% a year, the way we think QQQ ought to grow over time. Twice a year we look at the line. If QQQ has fallen behind, we buy more. If it's run past, we sell a little. That is the whole strategy. It fits on an index card.

Author: Brent Wood Published: May 25, 2026 Status: Locked

CAGR (27.2y)

14.04%

QQQ B&H: 10.96%

Alpha Outperf

+3.08%

per annum vs QQQ B&H

Max Drawdown

-42.1%

QQQ B&H: -83.0%

After-Tax CAGR

13.83%

QQQ B&H: 9.85% · +397 bp/yr

Executive Summary

AlphaStrat 2.0 is the simplest investment rule I know how to build, and I've been building these for a while. It owns two things: shares of QQQ, the Nasdaq-100 fund, and BIL, a fund that holds short Treasury bills and pays you a few percent a year for parking your money there. And it follows one rule: keep the QQQ pile growing at 18% a year on paper.

Now, 18% is a tall order. Neither I nor anybody else can promise that QQQ will actually deliver 18% a year going forward. But the rule doesn't care about promises. It just looks at where QQQ ought to be if it had been keeping up with the line, and where it actually is. If QQQ has slipped behind, the rule sells some BIL and buys more QQQ. If QQQ has gotten ahead of itself, the rule takes a little off the top and parks it back in BIL. Same rule in 1999 as in 2026. A computer does it. No phone calls.

The setup is straightforward. On day one, you put thirty cents of every dollar into QQQ and seventy cents into BIL. That's a big cash cushion — bigger than most professional investors would tolerate. The point of the cushion is to have something to spend when QQQ goes on sale, which it does every five or ten years like clockwork. In 2002 the cushion bought QQQ at about $25 a share. In 2009 it bought it again. In 2022 it bought it once more. Each time, the math said the shares were cheap relative to where the line said they should be. The rule didn't argue. It bought.

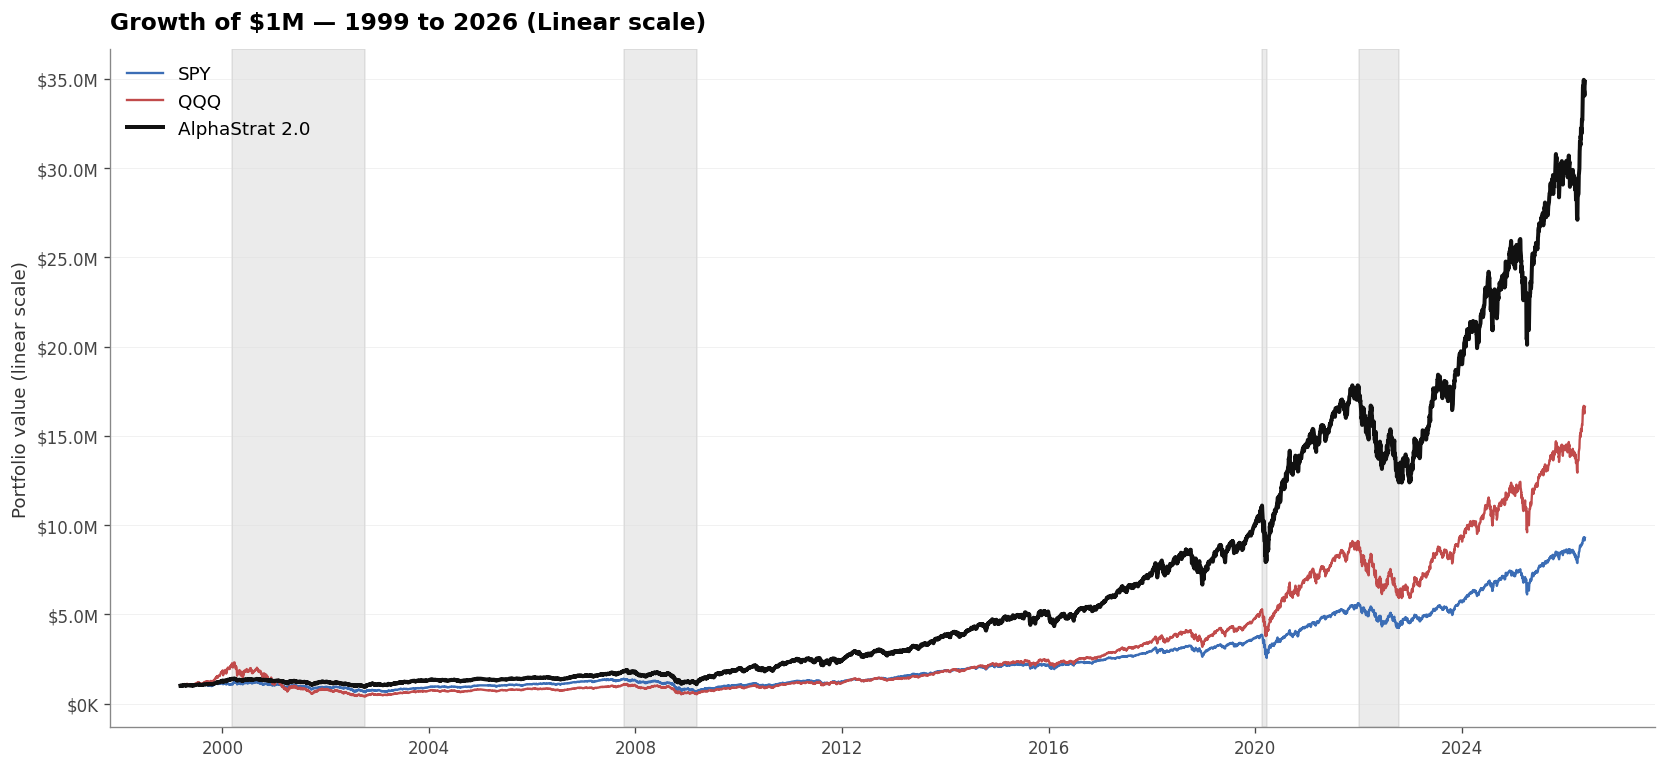
Here is the result. From March 1999 through May 2026 — a stretch that included the dot-com unwind, the 2008 banking crisis, COVID, the 2022 sell-off, and three roaring bull markets — a million dollars handed to the rule on day one would be worth about $34.8 million today. The same million in QQQ would be $16.6 million. That works out to 14% a year compounded for the rule, 11% for QQQ. After the taxman takes his cut at top federal rates, the rule still compounds at 13.8% a year, while QQQ buy-and-hold drops to 9.9%. The worst stretch the rule lived through was a 42% drawdown. QQQ's worst was 83%. I'd rather lose 42 cents and have the chance to make them back than lose 83 cents and spend a decade waiting.

What this strategy gives up

The rule is not free. It will underperform QQQ in years when QQQ is in mania mode and nothing crashes. We saw this in 1999, when QQQ ran up 79% in nine months and the rule only made 26%. We saw it again from 2017 to 2020, when a small handful of growth stocks were doing all the heavy lifting in the index. If the next twenty years turn out to be a long calm bull market with no real corrections, you would have been better off in QQQ than in this rule. The rule is built to survive bad weather, not to win blue-sky days. If you cannot stomach being the person at the dinner party who didn't own whatever stock the magazine cover featured, this strategy will be painful to hold.
The Rule

The whole strategy fits on a napkin. Five lines:

1. At t=0, allocate 30% of capital to QQQ, 70% to BIL.
2. Compute a static target line: target(t) = initial_QQQ × (1.18)^years_elapsed.
3. Every 6 months, check the QQQ bucket against the line.
4. If QQQ is more than ±20% off the line: trade enough QQQ to bring it back. Buy from BIL; trim into BIL.
5. If BIL is exhausted during a crash, do nothing more — wait for QQQ to recover.

A couple of things follow from these rules that are easy to miss. The first is that the line on the wall never moves. The target at year ten was decided on day one — no recalibration, no "well, the world has changed." The line is the rule's stubborn opinion about what QQQ ought to do. Reality wobbles around it, and the rule's job is to drag the portfolio back. If the rule and reality disagree, the rule just keeps doing its thing.

The second is that the 20% deadband — the part where we don't act unless QQQ is more than 20% off the line — means the rule almost never trades. Over 27 years, the rule made exactly ten trades. Most years it sat on its hands. When it did act, it acted decisively: typically deploying $300,000 to $1,000,000 of cash into QQQ at a crash bottom, or trimming a comparable amount near a peak. The rest of the time, it watched.

Backtest Results (1999-03-10 → 2026-05-22)

A million dollars handed to the rule in March 1999 would have grown to about $34.8 million by May 2026. The same million in QQQ would be $16.6 million. In the S&P 500, $9.3 million. Those are 27-year compound rates of 14%, 11%, and 9% respectively. The rule did better than QQQ by roughly $18 million, and better than the S&P by roughly $25 million, on a starting stake of $1 million. The compounding does the work; the rule just stays out of its own way.

AlphaStrat 2.0 Growth of One Million Chart
Figure 1: Growth of $1,000,000 (1999 - 2026). AlphaStrat 2.0 (black) plotted against SPY and QQQ buy-and-hold. Gray bands mark the four major crises: dot-com (2000-2002), GFC (2008-09), COVID (2020), 2022 rate-shock bear. Log scale.

Headline numbers

Metric AlphaStrat 2.0 QQQ B&H SPY B&H
CAGR14.04%10.96%8.62%
Sharpe Ratio0.810.520.52
Max Drawdown-42.10%-82.99%-55.19%
Final Equity ($1M start)$34,823,086$16,606,203$9,338,883
Total Trades1011

The crashes are where the rule earns its keep

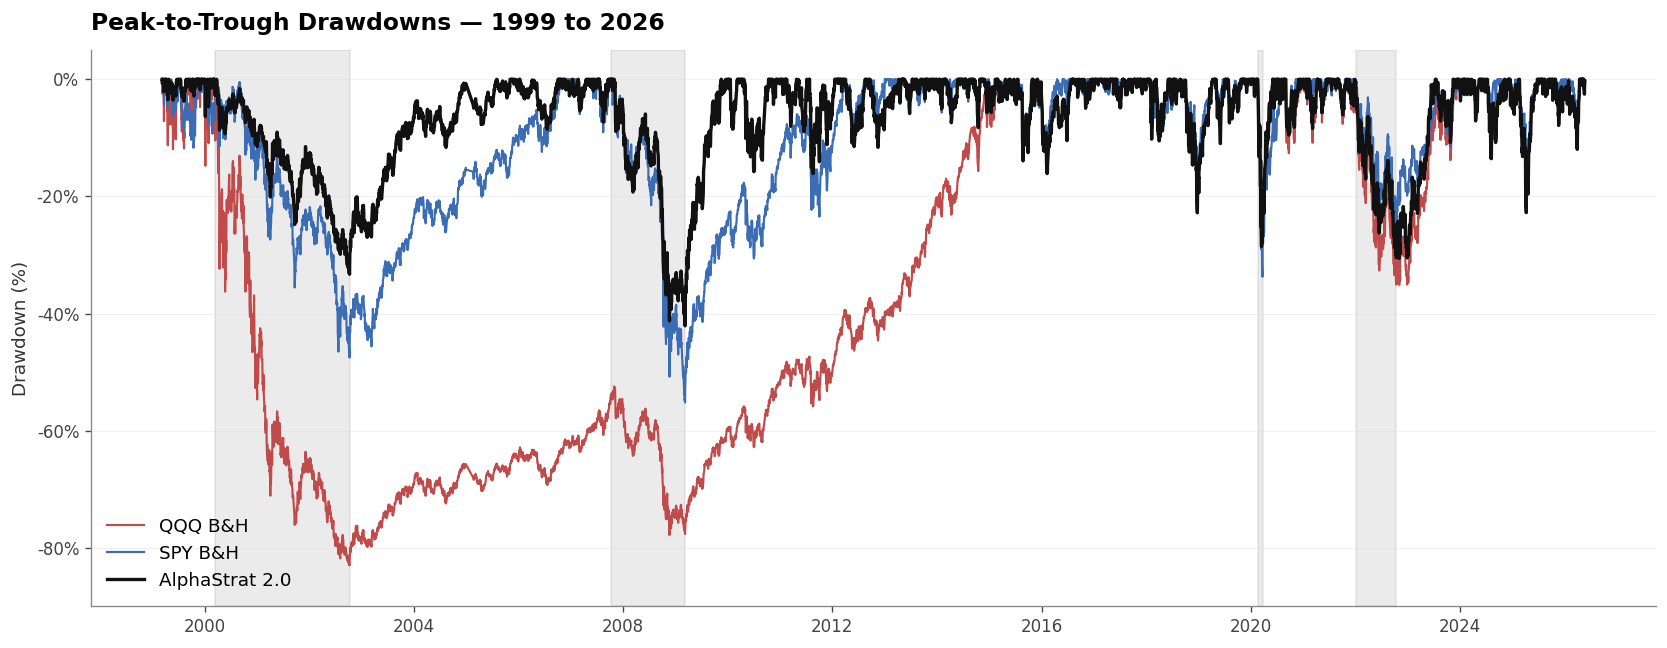
Look at the drawdown row. QQQ buy-and-hold lost 83% peak-to-trough during the dot-com unwind. That's the kind of loss that ends portfolios — not because the math is wrong, but because the person holding it usually can't stand it and sells at the bottom. The rule's worst stretch was a 42% drawdown, which is painful but survivable. The reason is structural: the rule holds the cushion ready and deploys it into the crash, not after. That is the whole pitch in one sentence.

AlphaStrat 2.0 Drawdown Chart
Figure 2: Peak-to-Trough Drawdowns (1999 - 2026). AlphaStrat 2.0 (black) vs QQQ and SPY buy-and-hold. The gap is widest precisely during the 2000-2002 dot-com unwind when QQQ B&H bottomed at -83% — exactly the regime 2.0 is built for.

The trade-off is honest. The 14% number is below what QQQ has done in calm windows. The rule's value is fully realized only across regimes that include major crashes — windows like the one we just tested, with two decade-defining selloffs in it. The crash protection isn't free. You pay for it in giveback during the manias.

Past performance is not future returns
The 14% number is a backtest. Nobody made any of this money. Backtests are stories told in a way that flatters their author, and you should read them skeptically. The next 27 years will not look exactly like the last 27.

Year-by-Year Cumulative Statement

The 14% annual number hides a lot of texture. In some years the rule was the dumbest thing at the dinner party — 1999, when QQQ ran 79% and the rule made 26% because it was sitting on a 70% cash cushion that the table thought was foolish. In other years it was the smartest — 2002, when QQQ lost half its value and the rule was up 4%, because the rule had spent the previous year buying the dip while the table was busy panic-selling. The pattern is steady: lose to QQQ in mania years, win decisively in crash years, and grind ahead through everything in between. Below is what your December 31 statement would have read every year if you put a million dollars in on day one and never touched it.

Compounded Year-End Statement Value
The table below shows what your account statement would have read at the close of each calendar year, starting from a million dollars in March 1999 and never adding or removing a dollar. The percentage is the cumulative gain from day one; the dollar figure is the actual account balance.
Year-end AlphaStrat 2.0 (Cumulative) SPY (Cumulative) QQQ (Cumulative)
1999+26.5% ($1.26M)+15.6% ($1.16M)+78.7% ($1.79M)
2000+25.8% ($1.26M)+4.3% ($1.04M)+14.2% ($1.14M)
2001+19.3% ($1.19M)-8.0% ($920K)-23.9% ($761K)
2002+3.7% ($1.04M)-27.8% ($722K)-52.3% ($477K)
2003+31.1% ($1.31M)-7.5% ($925K)-28.6% ($714K)
2004+39.1% ($1.39M)+2.4% ($1.02M)-21.2% ($788K)
2005+42.2% ($1.42M)+7.4% ($1.07M)-19.9% ($801K)
2006+53.5% ($1.54M)+24.4% ($1.24M)-14.2% ($858K)
2007+77.2% ($1.77M)+30.8% ($1.31M)+2.2% ($1.02M)
2008+20.9% ($1.21M)-17.3% ($827K)-40.5% ($595K)
2009+93.4% ($1.93M)+4.4% ($1.04M)-7.9% ($921K)
2010+131.9% ($2.32M)+20.2% ($1.20M)+10.4% ($1.10M)
2011+139.8% ($2.40M)+22.4% ($1.22M)+14.1% ($1.14M)
2012+183.1% ($2.83M)+42.0% ($1.42M)+34.8% ($1.35M)
2013+286.9% ($3.87M)+87.9% ($1.88M)+84.2% ($1.84M)
2014+361.1% ($4.61M)+113.2% ($2.13M)+119.5% ($2.19M)
2015+404.6% ($5.05M)+115.8% ($2.16M)+140.2% ($2.40M)
2016+440.4% ($5.40M)+141.7% ($2.42M)+157.2% ($2.57M)
2017+616.8% ($7.17M)+194.2% ($2.94M)+241.2% ($3.41M)
2018+615.9% ($7.16M)+180.8% ($2.81M)+240.8% ($3.41M)
2019+894.7% ($9.95M)+268.4% ($3.68M)+373.5% ($4.74M)
2020+1358.0% ($14.58M)+335.9% ($4.36M)+603.8% ($7.04M)
2021+1662.2% ($17.62M)+461.2% ($5.61M)+796.7% ($8.97M)
2022+1167.8% ($12.68M)+359.2% ($4.59M)+504.6% ($6.05M)
2023+1863.3% ($19.63M)+479.4% ($5.79M)+836.2% ($9.36M)
2024+2365.5% ($24.65M)+623.5% ($7.24M)+1075.7% ($11.76M)
2025+2877.6% ($29.78M)+751.8% ($8.52M)+1319.9% ($14.20M)
2026+3382.3% ($34.82M)+833.9% ($9.34M)+1560.6% ($16.61M)

Tax Efficiency — The Quiet Win

Most strategies that beat a benchmark on a backtest get eaten alive by the taxman. The reason is plain: trading is what kills you. Every rebalance that sells a winner crystallizes a gain that you owe the government the following April. A strategy that rotates through 30 stocks every quarter can hand back 30 or 40 cents of every dollar of alpha by the time the IRS is finished. AlphaStrat 2.0 does not have that problem.

Over the full 27 years, the rule made exactly ten trades. Most years it didn't trade at all. The wide deadband and the six-month checking schedule keep it dormant for years between actions. When it does act, the position has usually been sitting in the account for five to fifteen years, so the gain is long-term and gets taxed at the lower rate. The cushion's growth — about 4% a year of Treasury interest — is taxed every year, but in dollars it's small compared to the equity gains we eventually realize.

The rule kept 97 cents on the dollar

Across 27 years the rule generated about $33.8 million of pre-tax gains on a $1 million starting stake. At the highest federal rates I can think of (40.8% on short-term gains, 23.8% on long-term, including the 3.8% net investment income tax), the total federal bill comes to roughly $938,000 — about 2.8 cents of every dollar earned. QQQ buy-and-hold over the same window owes 23.8 cents on the dollar — one big tax bill at sale. The reason for the gap is simple: we sold rarely, and when we did, the lots had aged for a very long time.

Side-by-side after federal taxes

Strategy Pre-tax CAGR After-tax CAGR Tax drag Effective tax rate (% of gains)
AlphaStrat 2.0 13.94% 13.83% +11 bp/yr 2.8%
QQQ Buy-and-Hold 10.88% 9.85% +103 bp/yr 23.8%
SPY Buy-and-Hold 8.56% 7.61% +95 bp/yr 23.8%

The after-tax advantage over QQQ buy-and-hold is about four percentage points a year. That is wider than the pre-tax gap, because QQQ buy-and-hold owes one enormous tax bill at the end while the rule's gains are spread across the small handful of sales it makes. On a million dollars over 27 years, the after-tax difference comes out to $8.3 million. That is not a rounding error. That is, in fact, the difference between buying a house in cash at retirement and not.

I should add: tax efficiency was not what we set out to design. It is a consequence of the rule's structure — trade rarely, and when you do, sell lots that have aged a long time. But it is the side of the ledger that actually shows up in your bank account at the end of the year, and I would not want you to overlook it.

Why these specific numbers

You may reasonably wonder why we picked these four numbers — 18% target, 30% starting QQQ allocation, 20% deadband, six-month checking schedule — rather than some other combination. The answer is that we ran the rule with every reasonable combination over the full 1999-2026 stretch — about 7,680 different settings — and the one shown here was the winner. The important part: it was the winner on raw growth, but it also had one of the lowest drawdowns of any setting that delivered high growth. That conjunction is not an accident. The defensive shape — start with a lot of cash, use a wide deadband — is what lets the rule work across both bull markets and crashes.

If we ran the same exercise on a shorter, calmer window (2007 to 2026, no dot-com crash), a different winner showed up: 20% target, 70% starting QQQ, 15% deadband. That setting did 17.8% a year in the calm window, but only 13.1% across the full crash-inclusive window — and it suffered a 65% drawdown. We chose the 1999-winning shape because we would rather optimize for surviving regimes than for maximum return in any one regime. If the next 20 years include another dot-com-class event, you will be glad we did.

Locked parameters

target_cagr = 0.18 # slightly above realized QQQ over 27y
initial_risk_asset_pct = 0.30 # 30% QQQ / 70% BIL — large dry powder
band_pct = 0.20 # very wide deadband — no churn
rebalance_months = 6 # semi-annual checks
risk_asset_symbol = "QQQ" # default; sweepable to SPY, etc.

Honest caveats

A few things you should know before you take any of this too seriously.

Nobody made any of this money. The numbers in this note come from running the rule against historical price data with conservative friction assumptions. The rule has not yet been turned loose with real capital. Backtests are stories told in a way that flatters their author, and you should read them skeptically.

The six-month schedule got a little lucky on this start date. The December 2008 GFC bottom landed on a check date, so the rule did a big lump-sum buy at the cheapest QQQ has been in twenty years. A different start month would shift the schedule by weeks, and the rule might have missed the bottom by a couple of months. We tested 13 different start months across a six-month range; the rule still beat QQQ at every one of them, but the size of the win varied by about one and a half percentage points a year. The direction is robust; the precise size is not.

The rule was not designed for regimes outside its sample. If the next 27 years bring a Japan-style 30-year stagnation, sustained high inflation that destroys the cushion's purchasing power, or some structural change in how US equities work, this rule was not built for any of those. I cannot tell you what to do in those scenarios because I don't know.

Live execution will differ from a backtest. Real slippage, dividend timing, the precise mechanics of how Treasury bill interest accrues, and the way your broker reports lots will all produce numbers that don't exactly match what's in this note. Expect 50 to 100 basis points a year of friction the model doesn't capture. Plan for it.