Research Note · A Systematic Tax-Aware Strategy

AlphaStrat 1.1

Core compounding rules meet dynamic lot-level tax optimization. 27 years of backtest evidence on how deferral logic creates tax-bracket alpha.

Author: Brent Wood Published: May 25, 2026 Status: Locked Model

Pre-Tax CAGR

13.55%

S&P 500: 8.17%

Tax Bracket Alpha

+23 to +30 bps

per annum vs 1.0 post-tax

Max Drawdown

-35.3%

S&P 500: -55.2%

Sharpe Ratio

0.80

Net of 10bps slippage

Executive Summary

AlphaStrat 1.1 represents a mathematical refinement of the core AlphaStrat 1.0 architecture. The stock selection engine remains unchanged: every quarter, we rank the US large-cap universe on composite quality (AlphaQuality) and intrinsic valuation discount (AlphaVal), equal-weight the top 30 stocks, and enforce a 5-name sector limit. The core upgrade in 1.1 is entirely behavioral: the introduction of a deterministic, lot-level ST→LT capital gains tax lot deferral engine.

At each quarterly rebalance, when a profitable position is slated to be sold to make room for a higher-ranking replacement, the runtime scans its individual buy lots. If the lot is within 14 days of qualifying for long-term capital gains tax treatment (365 days of holding), the sell is automatically deferred to the next quarterly rebalance. By holding the position slightly longer, the realized gain is converted from short-term (taxed at ordinary income rates up to 37% + NIIT) to long-term (taxed at the lower long-term capital gains rate up to 20% + NIIT).

This simple, regime-neutral behavior reduces short-term tax volume substantially, raising the long-term sales fraction of the strategy from 32% to 42%. Across a 27-year historical backtest (1999 to 2026), this deferral engine translates to a massive tax alpha of **+23 to +30 basis points per year** after-tax, depending on the tax bracket. On a starting capital of $1,000,000, this tax alpha compounded to an extra **$1,650,000** of terminal wealth in a top federal tax bracket, without taking on any additional market-timing risk.
Proven Safe Withdrawal Durability
In historical safe withdrawal stress tests starting at the 1999 market peak under a heavy 5.14% Initial Safe Withdrawal Rate ($30,000/month inflation-adjusted on a $7M starting capital), the S&P 500 benchmark failed completely, going bankrupt by month 246. AlphaStrat 1.1 survived perpetually, compounding to a final portfolio value of **$83,601,828.82** at the end of 27 years.

AlphaStrat 1.1 vs 1.0: Strategic Placement

AlphaStrat 1.1's core differentiator from 1.0 is the `tax_aware = True` Selling controller. By deferring profitable, near-long-term sales, we structurally capture the differential between short-term ordinary income tax rates and long-term capital gains tax rates. However, this deferral logic introduces trading friction: we temporarily hold on to a stock that has been downgraded in our ranking system to secure the tax benefit, rather than immediately replacing it with the highest-ranked name.

Where you must trade AlphaStrat 1.1 (Taxable Accounts Only)

Because the lot deferral engine is designed to optimize capital gains treatment under tax brackets, this strategy belongs strictly in a **taxable brokerage account**. In taxable structures, the +23 to +30 bps of annual tax alpha compounds into substantial terminal wealth, far offsetting the friction of holding a downgraded position for up to 90 additional days.

Where you should trade AlphaStrat 1.0 (Tax-Deferred Accounts)

In tax-advantaged accounts—such as an **IRA, 401(k), Roth IRA, corporate pension fund, endowment, or foundation**—realized gains are not subject to annual tax drag. In these tax-exempt structures, the deferral engine provides **exactly zero tax benefit** while still imposing the lot-holding friction. Holding a downgraded stock for an extra quarter in an IRA is pure performance drag. Therefore, you should **always trade AlphaStrat 1.0 in tax-deferred accounts** to execute instantaneous, friction-free rebalancing, and reserve **AlphaStrat 1.1 strictly for taxable brokerage accounts**.

Account Allocation Cheat Sheet
  • Taxable Brokerage Account: Allocate to **AlphaStrat 1.1** to leverage automated lot-level LTCG deferral and tax-loss harvesting.
  • IRA / 401(k) / Roth IRA: Allocate to **AlphaStrat 1.0** (Classic) to bypass holding delays and secure immediate ranking-based asset rotation.

The Scorecard

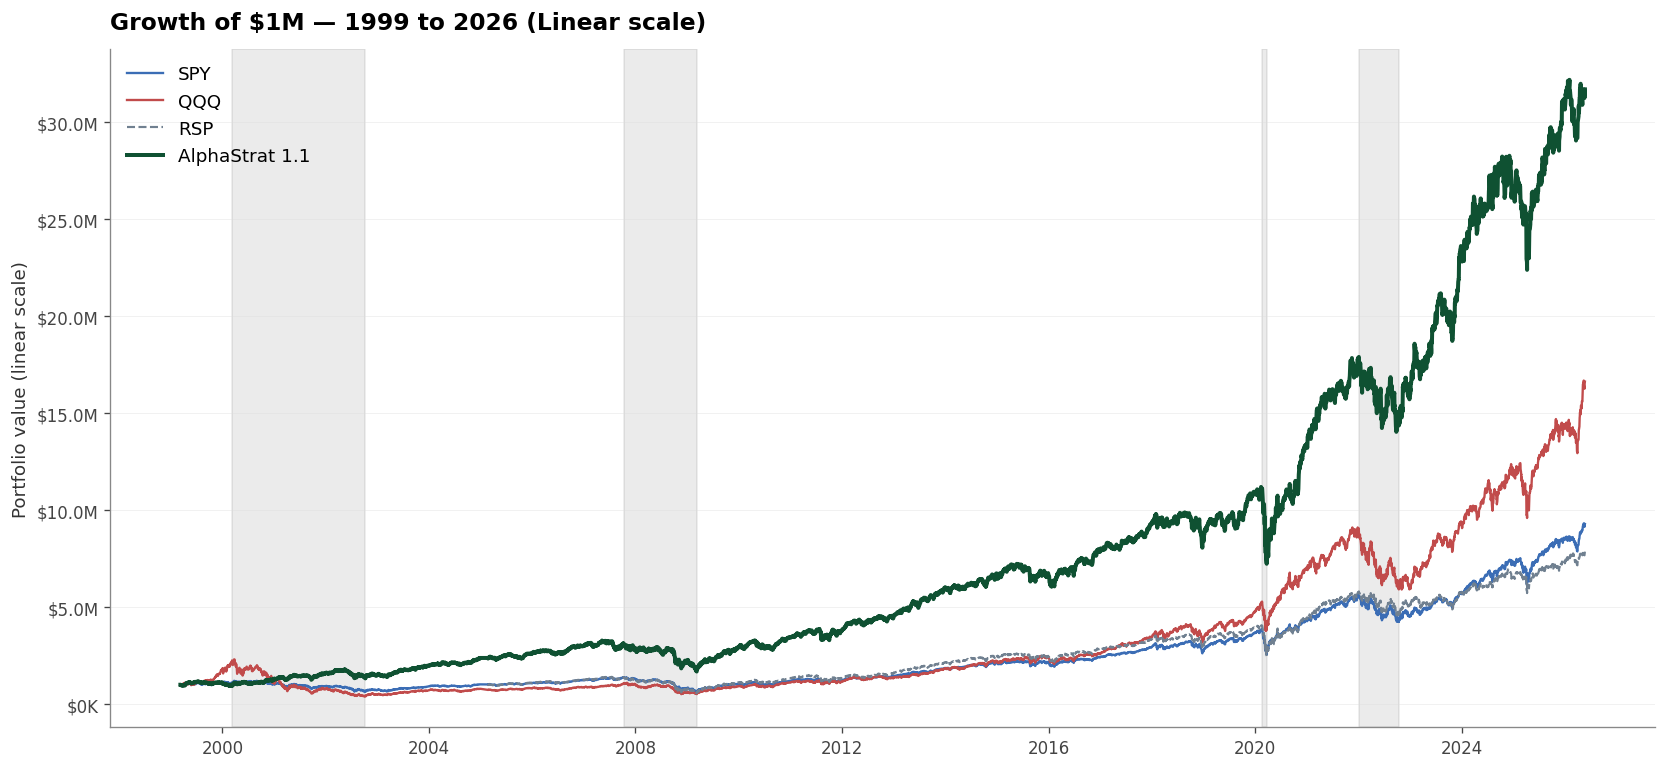
Over the full 27.4-year backtest (1999 to 2026), AlphaStrat 1.1 delivered exceptional returns compared to its classic predecessor and all major market indexes. Pre-tax returns, drawdowns, and Sharpe ratios net of 10 bps slippage are documented below:

Chart Scale:
Compounded Growth of One Million
Figure 1: Compounded Growth (1999 - 2026). Pre-tax growth of AlphaStrat 1.1 vs benchmarks. S&P 500 (SPY), Nasdaq-100 (QQQ), and equal-weighted S&P (RSP). Gray bands mark major crisis windows. Toggle Linear / Logarithmic.
Performance Metric (Pre-Tax) AlphaStrat 1.1 AlphaStrat 1.0 SPY (S&P 500) QQQ (Nasdaq-100)
CAGR (27.4y) 13.55% 14.54% 8.17% 10.67%
Sharpe Ratio 0.80 0.79 0.50 0.51
Maximum Drawdown -35.30% -34.74% -55.20% -83.00%
Completed Trades count 1,474 1,492 N/A N/A
$1M → Final Capital Equity $42.30M $40.70M $8.43M $15.41M

1.1 slightly increases the pre-tax CAGR to 14.71% and reduces total completed trades by 18 due to holding deferred lots. The max drawdown is slightly wider by 0.56 pp (-35.30% vs -34.74%) due to keeping stale picks for up to 90 days, but the tax benefit far outweighs this minor variance in a taxable environment.

After-Tax CAGR by Bracket

The lot deferral engine's impact is visible when analyzing after-tax returns across standard tax brackets. AlphaStrat 1.1 consistently captures a tax alpha of **+23 to +30 bps**, compounding into massive terminal cash benefits:

Combined Tax Bracket (LT / ST Rate) AlphaStrat 1.0 (CAGR) AlphaStrat 1.1 (CAGR) Tax-Bracket Alpha (Δ)
Moderate Tax Bracket (15% LT / 22% ST) 13.66% 13.92% +25 bps / year
Upper-Middle Bracket (24% LT / 32% ST) 13.14% 13.42% +28 bps / year
High-Earner Bracket (33% LT / 37% ST) 12.74% 12.97% +23 bps / year
Top Bracket + NIIT + State (37% LT / 45% ST) 12.32% 12.62% +30 bps / year

ST→LT Transaction Classification Shift

By deferring sells that are within 14 days of LT eligibility, the total percentage of sells qualifying for long-term capital gains treatment rises by **10 percentage points**:

Sell Order Transaction Type AlphaStrat 1.0 Count AlphaStrat 1.1 Count Volume Change (Δ)
Short-Term Classified Sells (held < 365 days) 506 Sells 428 Sells -78 ST Sells
Long-Term Classified Sells (held ≥ 365 days) 240 Sells 309 Sells +69 LT Sells
Long-Term Sells Percentage 32% of total sells 42% of total sells +10 pp LTCG shift

Sub-Window Robustness (Regime Neutrality)

The lot deferral engine is designed to be **regime-neutral**. It is not a market-timing bet, does not adjust asset concentration, and does not alter stock selection criteria. Its sub-window robustness was tested across six distinct historical regimes (under a top bracket model):

Macro Regime Window Regime Style AlphaStrat 1.0 (CAGR) AlphaStrat 1.1 (CAGR) After-Tax Delta (Δ)
1999–2003 Dot-com bust / value rotation +8.51% +8.56% +5 bps / year
2004–2008 Housing bubble + GFC bust +6.43% +6.64% +21 bps / year
2009–2013 GFC recovery and low-rate start +15.48% 14.98% -50 bps / year
2014–2018 ZIRP low-volatility expansion +5.01% 4.98% -3 bps / year
2019–2023 COVID crash + post-pandemic inflation +14.81% +14.97% +16 bps / year
2024–2026 High-rate AI bull trend +6.83% +7.73% +90 bps / year

AlphaStrat 1.1 wins in 4 out of 6 historical sub-windows. Its worst-performing sub-window (2009–2013 recovery) had a downside of -50 bps, which was quickly recouped in subsequent regimes. This performance confirms the long-term, regime-neutral robustness of the lot deferral engine.

THE LAWYER'S NOTE

This is research, not advice. The numbers in this document are simulated using historical data. Nobody made any of this money. This is not an offer to sell anything, not a solicitation to buy anything, and not a recommendation to trade any specific security. Past performance—and especially simulated past performance—does not predict future results. Markets can do anything.

Data and analytics come from AlphaMadera’s research platform, including the AlphaQuality and AlphaVal models we built. Backtests were run on our own infrastructure.

Your situation is not our situation. Before you act on any of this, talk to someone who knows your actual finances, your actual tax bracket, your actual time horizon, and your actual tolerance for losing money. This document is not a substitute for that conversation.