TG
Company Description
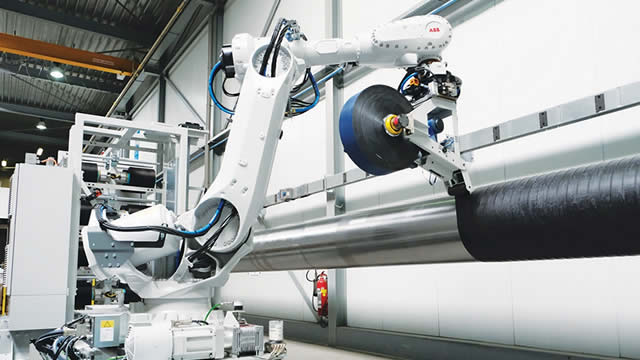
Tredegar Corporation, functioning through its affiliated entities, is a global producer and purveyor of key materials, including aluminum extrusions, as well as polyethylene (PE) and polyester films, reaching customers both in the United States and abroad. The company's operations are categorized into three principal divisions: Aluminum Extrusions, PE Films, and Flexible Packaging Films. The Aluminum Extrusions division crafts custom-fabricated and finished aluminum extrusions in soft-alloy and medium-strength formulations. These specialized products cater to a diverse array of industries, such as building and construction, automotive, transportation, consumer goods, industrial machinery and equipment, electrical and renewable energy, and distribution networks. This segment also provides mill-finished, anodized, painted, and fabricated aluminum extrusions directly to other manufacturing and distribution partners. Through its PE Films segment, Tredegar creates and supplies single and multi-layered surface protective films. These films are meticulously engineered to shield components in flat panel displays for devices like televisions, computer monitors, laptops, smartphones, tablets, e-readers, and digital signage, marketed under well-known brands such as UltraMask, ForceField, ForceField PEARL, and Pearl A. Additionally, this division offers fine-gauge films used for overwrapping consumer paper products like bathroom tissue and paper towels, along with other polyethylene overwrap solutions for various market demands. The Flexible Packaging Films segment concentrates on offering polyester-based films. These films are integral to food packaging and a broad spectrum of industrial uses, distributed under the Terphane, Ecophane, and Sealphane trademarks. Tredegar Corporation, founded in 1955, maintains its central administrative office in Richmond, Virginia.
Track Record
| Metric | 2025 | 2024 | 2023 | 2022 | 2021 | 2020 | 2019 | 2018 | 2017 | 2016 | 2015 | 2014 |
|---|---|---|---|---|---|---|---|---|---|---|---|---|
| Revenue | 722.86M | 598.02M | 573.32M | 761.99M | 826.46M | 755.29M | 826.32M | 851.83M | 961.33M | 828.34M | 896.18M | 951.83M |
| Net Income | 33.48M | (64.56M) | (105.91M) | 28.45M | 57.83M | (75.44M) | 48.26M | 24.84M | 38.25M | 24.47M | (32.13M) | 36.88M |
| EPS | 0.96 | -1.88 | -3.10 | 0.84 | 1.72 | -2.26 | 1.45 | 0.75 | 1.16 | 0.75 | -0.99 | 1.14 |
| Free Cash Flow | 15.74M | 11.16M | (2.45M) | (57.72M) | 43.22M | 51.02M | 65.00M | 56.98M | 43.85M | 3.42M | 41.42M | 6.34M |
| FCF / Share | 0.45 | 0.32 | -0.07 | -1.71 | 1.29 | 1.53 | 1.96 | 1.72 | 1.33 | 0.10 | 1.27 | 0.20 |
| Operating CF | 32.98M | 25.51M | 24.00M | (20.84M) | 70.58M | 74.37M | 115.86M | 97.79M | 88.22M | 48.87M | 74.26M | 51.23M |
| Total Assets | 371.37M | 356.36M | 446.46M | 542.09M | 523.58M | 514.87M | 712.67M | 707.37M | 755.74M | 651.16M | 623.26M | 788.63M |
| Total Debt | 48.27M | 77.37M | 158.62M | 151.77M | 87.99M | 151.03M | 61.77M | 101.50M | 152.00M | 95.00M | 104.00M | 137.25M |
| Cash & Equiv | 6.73M | 7.06M | 9.66M | 19.23M | 30.52M | 11.85M | 31.42M | 34.40M | 36.49M | 29.51M | 44.16M | 50.06M |
| Book Value | 216.55M | 180.97M | 155.65M | 201.76M | 184.72M | 109.06M | 376.75M | 354.86M | 343.78M | 310.78M | 272.75M | 372.03M |
| Return on Equity | 0.15 | -0.36 | -0.68 | 0.14 | 0.31 | -0.69 | 0.13 | 0.07 | 0.11 | 0.08 | -0.12 | 0.10 |
| Metric | Q1 2026 | Q4 2025 | Q3 2025 | Q2 2025 | Q1 2025 | Q4 2024 | Q3 2024 | Q2 2024 | Q1 2024 | Q4 2023 | Q3 2023 | Q2 2023 |
|---|---|---|---|---|---|---|---|---|---|---|---|---|
| Revenue | 186.49M | 184.07M | 194.94M | 179.12M | 164.74M | 50.00M | 146.06M | 153.94M | 143.97M | 136.17M | 166.19M | 178.17M |
| Net Income | 5.66M | 14.57M | 7.07M | 1.73M | 10.10M | (72.70M) | (3.95M) | 8.79M | 3.29M | (35.59M) | (50.38M) | (18.92M) |
| EPS | 0.17 | 0.42 | 0.20 | 0.05 | 0.29 | 0.06 | -0.11 | 0.26 | 0.10 | -1.04 | -1.47 | -0.56 |
| Free Cash Flow | (3.19M) | 7.71M | 16.51M | (527,000) | (7.96M) | 12.80M | (4.19M) | 12.73M | (10.18M) | (24.42M) | 15.18M | 24.92M |
| FCF / Share | -0.09 | 0.22 | 0.47 | -0.02 | -0.23 | 0.37 | -0.12 | 0.37 | -0.30 | -0.71 | 0.44 | 0.73 |
| Operating CF | 1.95M | 15.71M | 20.12M | 2.15M | (5.01M) | 19.45M | (1.28M) | 15.05M | (7.72M) | (20.24M) | 21.54M | 31.81M |
| Total Assets | 403.64M | 371.37M | 378.81M | 371.58M | 374.22M | 356.36M | 442.54M | 450.41M | 442.53M | 446.46M | 479.52M | 484.87M |
| Total Debt | 58.89M | 48.27M | 63.32M | 77.00M | 71.62M | 77.37M | 160.14M | 159.49M | 166.52M | 158.62M | 168.30M | 155.15M |
| Cash & Equiv | 15.61M | 6.73M | 13.29M | 9.79M | 3.66M | 7.06M | 2.72M | 3.51M | 4.79M | 9.66M | 48.60M | 21.19M |
| Book Value | 223.79M | 216.55M | 202.19M | 194.11M | 191.37M | 180.97M | 158.45M | 159.96M | 156.81M | 155.65M | 154.19M | 183.15M |
| Return on Equity | 0.03 | 0.07 | 0.03 | 0.01 | 0.05 | -0.40 | -0.02 | 0.05 | 0.02 | -0.23 | -0.33 | -0.10 |