SMPL
Company Description
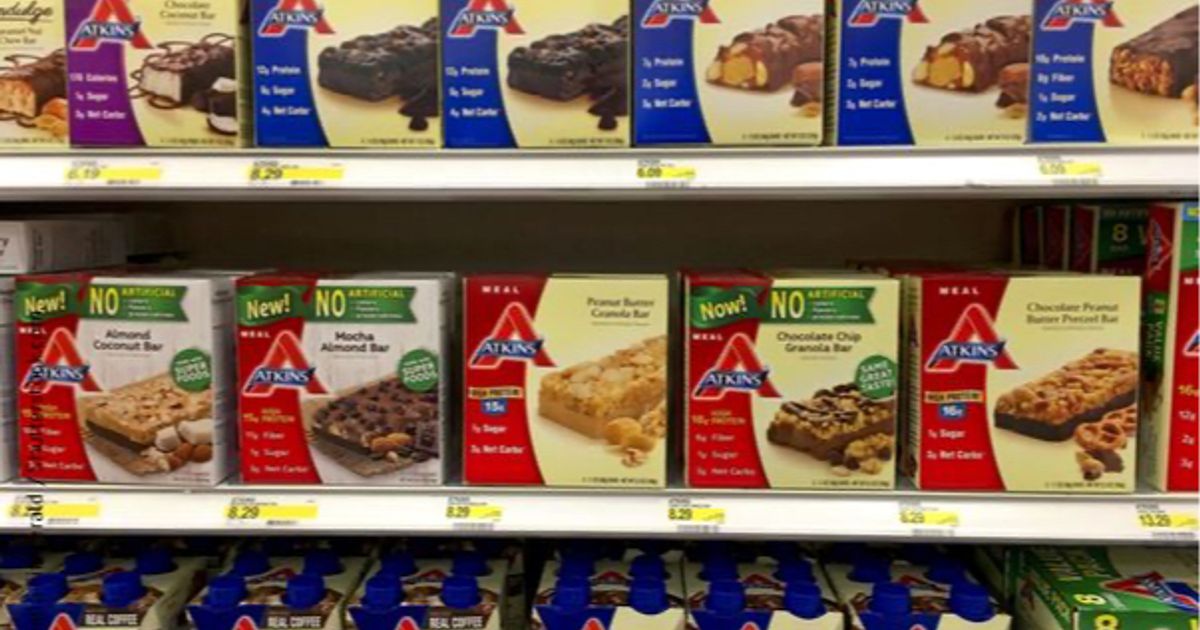
The Simply Good Foods Company operates as a global purveyor of consumer packaged food and beverage items, with a significant presence across North America and in international markets. Its core business revolves around the creation, promotion, and sale of a diverse portfolio of snacks and meal replacement solutions. The company's extensive product line encompasses protein bars, convenient ready-to-drink shakes, various sweet and savory snack options, cookies, pizzas, protein-enriched chips, culinary recipes, and confectionery. These offerings are available under well-recognized brand identities, including Atkins, Atkins Endulge, and Quest, with the latter also extending to licensed frozen meals. The Simply Good Foods Company ensures broad availability through an extensive distribution network that includes major retailers, grocery chains, pharmacies, wholesale club stores, convenience stores, and gas stations. Furthermore, it actively engages in e-commerce, selling its products directly to consumers through dedicated online platforms such as atkins.com and questnutrition.com, as well as via amazon.com. The enterprise is headquartered in Denver, Colorado.
Track Record
| Metric | 2025 | 2024 | 2023 | 2022 | 2021 | 2020 | 2019 | 2018 | 2017 | 2016 | 2015 | 2014 |
|---|---|---|---|---|---|---|---|---|---|---|---|---|
| Revenue | 1.45B | 1.33B | 1.24B | 1.17B | 1.01B | 816.64M | 523.76M | 431.43M | 396.17M | 427.86M | 379.35M | 429.86M |
| Net Income | 103.61M | 139.31M | 133.57M | 108.57M | 40.88M | 65.64M | (25.23M) | 70.45M | (2.04M) | (192,503) | (7.90M) | 13.96M |
| EPS | 1.03 | 1.39 | 1.34 | 1.10 | 0.43 | 0.37 | -0.30 | 0.53 | -0.03 | -0.02 | -0.79 | 1.38 |
| Free Cash Flow | 157.91M | 208.03M | 156.24M | 104.34M | 125.38M | 57.19M | 72.00M | 58.95M | (6.37M) | (216,130) | 19.46M | 22.60M |
| FCF / Share | 1.57 | 2.08 | 1.57 | 1.06 | 1.31 | 0.61 | 0.84 | 0.84 | -0.09 | -0.02 | 1.93 | 2.24 |
| Operating CF | 178.46M | 214.50M | 168.42M | 110.09M | 132.09M | 58.92M | 73.04M | 60.72M | (5.42M) | (216,133) | 20.43M | 23.48M |
| Total Assets | 2.40B | 2.48B | 2.13B | 2.12B | 2.08B | 2.03B | 1.15B | 996.61M | 922.49M | 404.09M | N/A | N/A |
| Total Debt | 304.43M | 437.31M | 327.70M | 454.17M | 500.23M | 624.24M | 190.94M | 191.58M | 217.76M | 0 | N/A | N/A |
| Cash & Equiv | 98.47M | 132.53M | 87.72M | 67.49M | 75.34M | 95.85M | 266.34M | 111.97M | 56.50M | 954,102 | N/A | N/A |
| Book Value | 1.81B | 1.73B | 1.57B | 1.44B | 1.19B | 1.14B | 712.87M | 672.60M | 598.70M | 389.68M | N/A | N/A |
| Return on Equity | 0.06 | 0.08 | 0.09 | 0.08 | 0.03 | 0.06 | -0.04 | 0.10 | -0.00 | -0.00 | N/A | N/A |
| Metric | Q3 2026 | Q2 2026 | Q1 2026 | Q4 2025 | Q3 2025 | Q2 2025 | Q1 2025 | Q4 2024 | Q3 2024 | Q2 2024 | Q1 2024 | Q4 2023 |
|---|---|---|---|---|---|---|---|---|---|---|---|---|
| Revenue | 356.98M | 326.01M | 340.20M | 369.04M | 380.96M | 359.65M | 341.27M | 375.69M | 334.76M | 312.20M | 308.68M | 320.42M |
| Net Income | (51.97M) | (159.70M) | 25.27M | (12.36M) | 41.10M | 36.75M | 38.12M | 29.29M | 41.33M | 33.12M | 35.56M | 36.64M |
| EPS | -0.58 | -1.73 | 0.26 | -0.12 | 0.41 | 0.36 | 0.38 | 0.29 | 0.41 | 0.33 | 0.36 | 0.37 |
| Free Cash Flow | N/A | 2.56M | 48.00M | 27.34M | 68.11M | 30.75M | 31.71M | 43.12M | 72.01M | 46.12M | 46.78M | 58.62M |
| FCF / Share | N/A | 0.03 | 0.49 | 0.27 | 0.67 | 0.30 | 0.32 | 0.43 | 0.72 | 0.46 | 0.47 | 0.59 |
| Operating CF | N/A | 8.10M | 50.09M | 45.37M | 69.82M | 31.25M | 32.02M | 47.75M | 72.76M | 46.47M | 47.52M | 60.70M |
| Total Assets | 2.06B | 2.13B | 2.45B | 2.40B | 2.43B | 2.43B | 2.43B | 2.48B | 2.19B | 2.15B | 2.12B | 2.13B |
| Total Debt | 397.04M | 396.87M | 451.09M | 304.43M | 304.73M | 334.85M | 386.69M | 437.31M | 276.93M | 278.82M | 315.14M | 327.70M |
| Cash & Equiv | 123.88M | 107.44M | 194.05M | 98.47M | 98.01M | 103.68M | 121.76M | 132.53M | 208.68M | 135.88M | 121.39M | 87.72M |
| Book Value | 1.42B | 1.49B | 1.73B | 1.81B | 1.84B | 1.82B | 1.78B | 1.73B | 1.69B | 1.65B | 1.61B | 1.57B |
| Return on Equity | -0.04 | -0.11 | 0.01 | -0.01 | 0.02 | 0.02 | 0.02 | 0.02 | 0.02 | 0.02 | 0.02 | 0.02 |