SGI
Somnigroup International Inc
$64.68
-1.31
(-1.99%)
Mkt Cap
14.89B
Volume
1,731,988
52W Range
60.08-98.56
Sector
Consumer Cyclical
Beta
1.24
EPS (TTM)
2.55 USD
P/E Ratio
25.36
Revenue (TTM)
7.62B USD
Rev Growth (5Y)
+15.3%
EPS Growth (5Y)
+2.1%
AlphaVal · Fair Value
What we estimate one share is worth
$29.44
Overvalued
strong signal
119.7% above fair value
Modeled from cash flows & growth.
AlphaQuality · Grade
How strong & durable the business is
B-
Stable Earnings Power
62.3 / 100 composite
Steady, predictable earnings power — graded A–F vs. similar companies.
Company Description
Somnigroup International Inc., operating as Somni, leads the field in advanced sleep technology and holistic wellness solutions. They engineer groundbreaking products specifically designed to elevate sleep quality. Their approach seamlessly integrates scientifically validated methods, intelligent technology, and data-driven insights to optimize sleep patterns and foster overall well-being.
Track Record
Showing latest 4 periods • Swipe for more
| Metric | 2025 | 2024 | 2023 | 2022 | 2021 | 2020 | 2016 | 2015 | 2014 | 2013 | 2012 | 2011 |
|---|---|---|---|---|---|---|---|---|---|---|---|---|
| Revenue | 7.48B | 4.93B | 4.93B | 4.92B | 4.93B | 3.68B | 532.93M | 521.26M | 529.95M | 767.23M | 752.99M | 629.57M |
| Net Income | 384.10M | 384.30M | 368.10M | 455.70M | 624.50M | 348.80M | (11.18M) | (39.15M) | (52.81M) | (2.82M) | (24.46M) | (21.23M) |
| EPS | 1.86 | 2.21 | 2.14 | 2.61 | 3.17 | 1.68 | -0.31 | -1.10 | -1.49 | -0.08 | -0.76 | -0.69 |
| Free Cash Flow | 633.20M | 569.20M | 384.90M | 72.30M | 599.80M | 543.40M | 103.60M | 168.30M | 177.70M | 58.50M | 139.40M | 219.20M |
| FCF / Share | 3.07 | 3.28 | 2.24 | 0.41 | 3.04 | 2.61 | 0.50 | 0.81 | 5.00 | 0.28 | 0.74 | 1.23 |
| Operating CF | 800.10M | 666.50M | 570.30M | 378.80M | 723.10M | 654.70M | 165.50M | 234.20M | 225.20M | 98.50M | 189.90M | 248.70M |
| Total Assets | 11.61B | 5.98B | 4.55B | 4.36B | 4.32B | 3.31B | 356.13M | 387.58M | 364.94M | 407.85M | 496.88M | 450.56M |
| Total Debt | 8.26B | 4.47B | 3.27B | 3.37B | 2.86B | 1.70B | 61.68M | 70.91M | 59.97M | 35.36M | 48.59M | 0 |
| Cash & Equiv | 134.90M | 117.40M | 74.90M | 69.40M | 300.70M | 65.00M | 92.95M | 67.19M | 109.30M | 175.18M | 104.85M | 139.87M |
| Book Value | 3.11B | 559.00M | 323.40M | (22.10M) | 285.80M | 503.60M | 55.19M | 53.38M | 82.15M | 130.25M | 110.89M | 123.29M |
| Return on Equity | 0.12 | 0.69 | 1.14 | N/A | 2.19 | 0.69 | -0.20 | -0.73 | -0.64 | -0.02 | -0.22 | -0.17 |
| Metric | Q2 2026 | Q1 2026 | Q4 2025 | Q3 2025 | Q2 2025 | Q1 2025 | Q4 2024 | Q3 2024 | Q2 2024 | Q1 2024 | Q4 2023 | Q3 2023 |
|---|---|---|---|---|---|---|---|---|---|---|---|---|
| Revenue | 1.82B | 1.80B | 1.87B | 2.12B | 1.88B | 1.60B | 1.21B | 1.30B | 1.23B | 1.19B | 1.17B | 1.28B |
| Net Income | 110.90M | 104.20M | 140.80M | 177.40M | 99.00M | (33.10M) | 71.90M | 130.00M | 106.10M | 76.30M | 77.10M | 113.30M |
| EPS | 0.53 | 0.50 | 0.67 | 0.85 | 0.47 | -0.17 | 0.41 | 0.75 | 0.61 | 0.44 | 0.45 | 0.66 |
| Free Cash Flow | 181.60M | 186.00M | 41.10M | 360.30M | 149.40M | 82.40M | 108.20M | 240.20M | 122.10M | 98.70M | 59.00M | 188.10M |
| FCF / Share | 0.86 | 0.88 | 0.20 | 1.72 | 0.71 | 0.42 | 0.62 | 1.38 | 0.70 | 0.57 | 0.34 | 1.09 |
| Operating CF | 236.30M | 246.50M | 99.40M | 408.20M | 186.10M | 106.40M | 129.10M | 256.60M | 150.60M | 130.20M | 91.10M | 228.70M |
| Total Assets | 11.61B | 11.54B | 11.61B | 11.40B | 11.38B | 11.33B | 5.98B | 4.57B | 4.58B | 4.59B | 4.55B | 4.55B |
| Total Debt | 6.41B | 6.53B | 8.26B | 6.62B | 6.84B | 6.94B | 4.47B | 2.95B | 3.17B | 3.25B | 3.27B | 3.25B |
| Cash & Equiv | 112.00M | 110.80M | 134.90M | 100.20M | 98.10M | 111.10M | 117.40M | 104.20M | 95.80M | 92.50M | 74.90M | 91.60M |
| Book Value | 3.23B | 3.15B | 3.11B | 2.99B | 2.84B | 2.74B | 559.00M | 564.50M | 411.80M | 326.60M | 323.40M | 214.10M |
| Return on Equity | 0.03 | 0.03 | 0.05 | 0.06 | 0.03 | -0.01 | 0.13 | 0.23 | 0.26 | 0.23 | 0.24 | 0.53 |
SGI News

Leggett Dynamics's Mid-Class Massage System Wins Gasgoo's Best Technical Practice Award

Why Somnigroup International (SGI) is a Top Growth Stock for the Long-Term
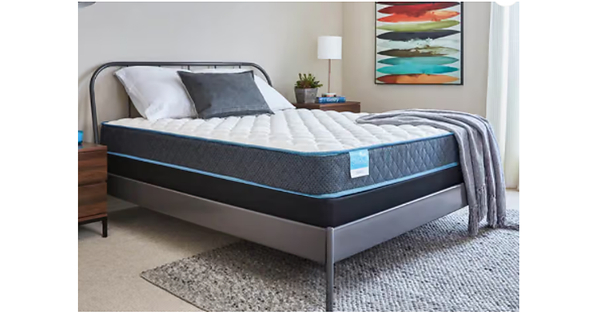
The Best Black Friday Mattress Deals Are Here at Mattress Firm

Somnigroup to Report Third Quarter 2026 Financial Results

Can Somnigroup's Brand Strength and Innovation Efforts Drive Growth?
Contrasting Somnigroup International (NYSE:SGI) and Green Brick Partners (NASDAQ:GRBK)

Somnigroup Advances Growth With Innovation and Retail Synergies

Leggett Dynamics Expands Asia Pacific Headquarters
Somnigroup International Inc. (NYSE:SGI) Receives Consensus Rating of “Moderate Buy” from Brokerages
Head-To-Head Contrast: M/I Homes (NYSE:MHO) versus Somnigroup International (NYSE:SGI)