REPX
Company Description
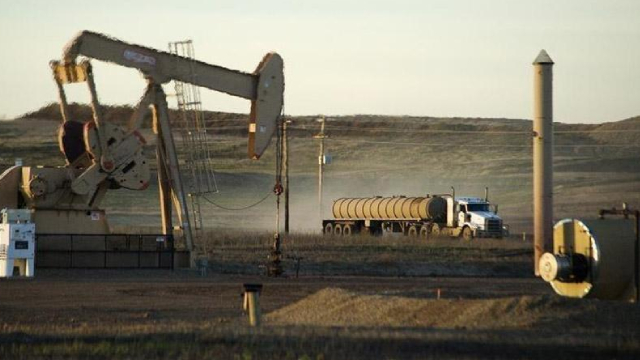
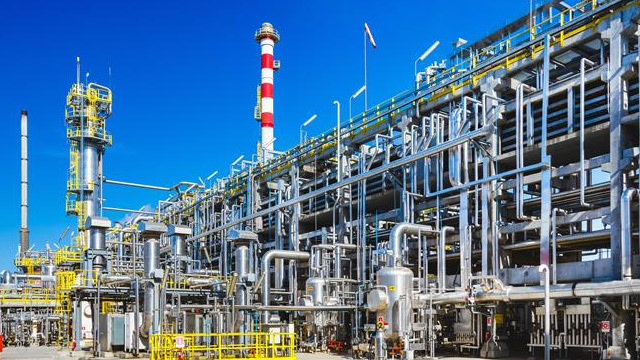
Riley Exploration Permian, Inc. (REPX) functions as an independent energy company, engaged in the entire process of hydrocarbon extraction—from acquiring properties and exploring for reserves to developing sites and producing oil, natural gas, and natural gas liquids across the states of Texas and New Mexico. The company primarily concentrates its activities on the San Andres Formation, a geological shelf margin deposit located within the Central Basin Platform and Northwest Shelf areas. REPX's landholdings are predominantly comprised of interconnected blocks situated in Yoakum County, Texas, along with Lea and Roosevelt Counties, New Mexico. As of the end of the third quarter of 2021 (September 30, 2021), the company reported approximately 31,352 net acres and operated a total of 77 net producing wells. Riley Exploration Permian, Inc.'s main office is located in Oklahoma City, Oklahoma.
Track Record
| Metric | 2025 | 2024 | 2023 | 2022 | 2021 | 2020 | 2019 | 2018 | 2017 | 2016 | 2015 | 2014 |
|---|---|---|---|---|---|---|---|---|---|---|---|---|
| Revenue | 391.98M | 410.18M | 375.05M | 321.74M | 151.04M | 3.04M | 4.91M | 5.87M | 5.26M | 4.67M | 6.16M | 13.79M |
| Net Income | 160.84M | 88.90M | 111.59M | 118.01M | (65.67M) | (3.65M) | (436,000) | 1.57M | (574,000) | (4.20M) | (24.72M) | (788,000) |
| EPS | 7.61 | 4.29 | 5.66 | 6.04 | -4.19 | -0.49 | -0.49 | 1.77 | -0.68 | -8.27 | -48.76 | -1.55 |
| Free Cash Flow | 86.25M | 116.35M | 65.89M | 42.03M | 25.59M | (1.66M) | (213,000) | 299,000 | (32,000) | (1.46M) | (475,000) | 2.44M |
| FCF / Share | 4.08 | 5.62 | 3.34 | 2.14 | 1.60 | -1.87 | -0.24 | 0.34 | -0.04 | -2.88 | -0.94 | 4.81 |
| Operating CF | 212.54M | 246.27M | 207.19M | 170.29M | 86.08M | (1.55M) | 226,000 | 1.34M | 154,000 | (1.01M) | 96,000 | 6.45M |
| Total Assets | 1.17B | 993.50M | 945.71M | 515.29M | 396.17M | 5.37M | 8.92M | 9.48M | 8.11M | 8.56M | 11.99M | 37.03M |
| Total Debt | 255.01M | 277.17M | 362.00M | 60.61M | 67.53M | 119,000 | 143,000 | 124,000 | 90,000 | 2.50M | 1.01M | 889,000 |
| Cash & Equiv | 17.89M | 13.12M | 15.32M | 13.30M | 8.32M | 1.56M | 3.06M | 3.12M | 185,000 | 76,000 | 40,000 | 35,000 |
| Book Value | 634.24M | 510.62M | 421.60M | 333.45M | 237.84M | 2.71M | 6.35M | 6.77M | 5.17M | 3.28M | 7.46M | 32.17M |
| Return on Equity | 0.25 | 0.17 | 0.26 | 0.35 | -0.28 | -1.34 | -0.07 | 0.23 | -0.11 | -1.28 | -3.31 | -0.02 |
| Metric | Q1 2026 | Q4 2025 | Q3 2025 | Q2 2025 | Q1 2025 | Q4 2024 | Q3 2024 | Q2 2024 | Q1 2024 | Q4 2023 | Q3 2023 | Q2 2023 |
|---|---|---|---|---|---|---|---|---|---|---|---|---|
| Revenue | 113.88M | 97.28M | 106.85M | 85.39M | 102.46M | 102.69M | 102.34M | 105.40M | 99.74M | 99.83M | 108.29M | 99.91M |
| Net Income | (70.43M) | 85.40M | 16.34M | 30.47M | 28.63M | 10.93M | 25.66M | 33.55M | 18.76M | 38.02M | 8.65M | 33.07M |
| EPS | -3.38 | 4.04 | 0.77 | 1.44 | 1.36 | 0.52 | 1.22 | 1.61 | 0.94 | 1.92 | 0.44 | 1.68 |
| Free Cash Flow | 15.45M | 14.23M | 34.60M | 2.79M | 31.23M | 33.12M | 47.96M | 14.21M | 21.06M | 44.76M | 21.16M | 2.10M |
| FCF / Share | 0.74 | 0.67 | 1.63 | 0.13 | 1.48 | 1.57 | 2.28 | 0.68 | 1.06 | 2.26 | 1.07 | 0.11 |
| Operating CF | 47.18M | 64.87M | 63.65M | 33.64M | 50.38M | 66.38M | 72.13M | 51.64M | 56.12M | 65.82M | 52.65M | 55.75M |
| Total Assets | 1.18B | 1.17B | 1.19B | 1.03B | 994.94M | 993.50M | 997.88M | 1.00B | 956.37M | 945.71M | 953.24M | 931.92M |
| Total Debt | 248.24M | 255.01M | 374.95M | 279.45M | 254.49M | 277.17M | 295.09M | 328.00M | 347.79M | 362.00M | 390.37M | 400.94M |
| Cash & Equiv | 15.81M | 17.89M | 16.46M | 14.03M | 8.86M | 13.12M | 13.32M | 10.91M | 6.56M | 15.32M | 10.37M | 6.74M |
| Book Value | 553.44M | 634.24M | 566.50M | 556.88M | 532.38M | 510.62M | 507.40M | 489.03M | 434.61M | 421.60M | 388.78M | 386.85M |
| Return on Equity | -0.13 | 0.13 | 0.03 | 0.05 | 0.05 | 0.02 | 0.05 | 0.07 | 0.04 | 0.09 | 0.02 | 0.09 |