NLY
Company Description
Annaly Capital Management, Inc. (NLY) operates as a multifaceted financial firm, specializing in managing capital across various sectors. Its core business encompasses mortgage-related investments and lending to middle-market corporations. NLY strategically deploys capital across a diverse range of assets, including government-sponsored (Agency) and privately-issued (non-Agency) mortgage-backed securities, residential and commercial mortgage loans, mortgage servicing rights, credit risk transfer instruments, corporate debt, and other commercial real estate investments. Operating as a Real Estate Investment Trust (REIT), Annaly benefits from a particular tax structure. This designation exempts it from federal corporate income tax, provided it distributes the majority of its taxable earnings to its investors. Established in 1996, the firm's corporate headquarters are located in New York City.
Track Record
| Metric | 2025 | 2024 | 2023 | 2022 | 2021 | 2020 | 2019 | 2018 | 2017 | 2016 | 2015 | 2014 |
|---|---|---|---|---|---|---|---|---|---|---|---|---|
| Revenue | 6.70B | 6.36B | 5.61B | 4.15B | 751.40M | 1.48B | 1.81B | 2.08B | 2.35B | 1.99B | 1.39B | 943.75M |
| Net Income | 2.03B | 1.00B | (1.64B) | 1.73B | 2.39B | (891.16M) | (2.16B) | 54.41M | 1.57B | 1.43B | 466.56M | (842.08M) |
| EPS | 2.92 | 1.62 | -3.61 | 3.93 | 6.40 | -2.92 | -6.41 | -0.25 | 5.48 | 5.56 | 1.68 | -3.84 |
| Free Cash Flow | (222.16M) | 2.45B | 1.97B | 4.36B | 2.54B | 527.97M | (1.20B) | 2.62B | 6.92B | 6.68B | (3.17B) | 6.13B |
| FCF / Share | -0.35 | 4.69 | 3.98 | 10.59 | 7.11 | 1.49 | -3.34 | 8.67 | 25.97 | 27.56 | -13.38 | 25.87 |
| Operating CF | 692.91M | 3.31B | 2.37B | 5.37B | 3.08B | 527.97M | (1.20B) | 2.62B | 6.93B | 6.86B | (3.17B) | 6.13B |
| Total Assets | 135.61B | 103.56B | 93.23B | 81.85B | 76.76B | 88.46B | 130.30B | 105.79B | 101.76B | 87.91B | 75.19B | 88.36B |
| Total Debt | 111.86B | 89.61B | 77.54B | 68.31B | 61.88B | 71.88B | 10.56B | 8.04B | 7.12B | 7.87B | 4.73B | 1.27B |
| Cash & Equiv | 2.04B | 285.15M | 275.85M | 152.55M | 119.58M | 1.24B | 1.85B | 1.74B | 706.59M | 1.54B | 1.77B | 1.74B |
| Book Value | 16.09B | 12.61B | 11.26B | 11.27B | 13.17B | 14.01B | 15.79B | 14.11B | 14.87B | 12.57B | 11.90B | 13.33B |
| Return on Equity | 0.13 | 0.08 | -0.15 | 0.15 | 0.18 | -0.06 | -0.14 | 0.00 | 0.11 | 0.11 | 0.04 | -0.06 |
| Metric | Q1 2026 | Q4 2025 | Q3 2025 | Q2 2025 | Q1 2025 | Q4 2024 | Q3 2024 | Q2 2024 | Q1 2024 | Q4 2023 | Q3 2023 | Q2 2023 |
|---|---|---|---|---|---|---|---|---|---|---|---|---|
| Revenue | 1.63B | 1.79B | 1.63B | 1.79B | 1.49B | 1.95B | 1.25B | 1.65B | 1.51B | 1.45B | 1.73B | 1.32B |
| Net Income | 282.65M | 1.01B | 832.45M | 57.10M | 124.22M | 482.05M | 66.44M | (9.48M) | 462.89M | (403.74M) | (562.21M) | 167.03M |
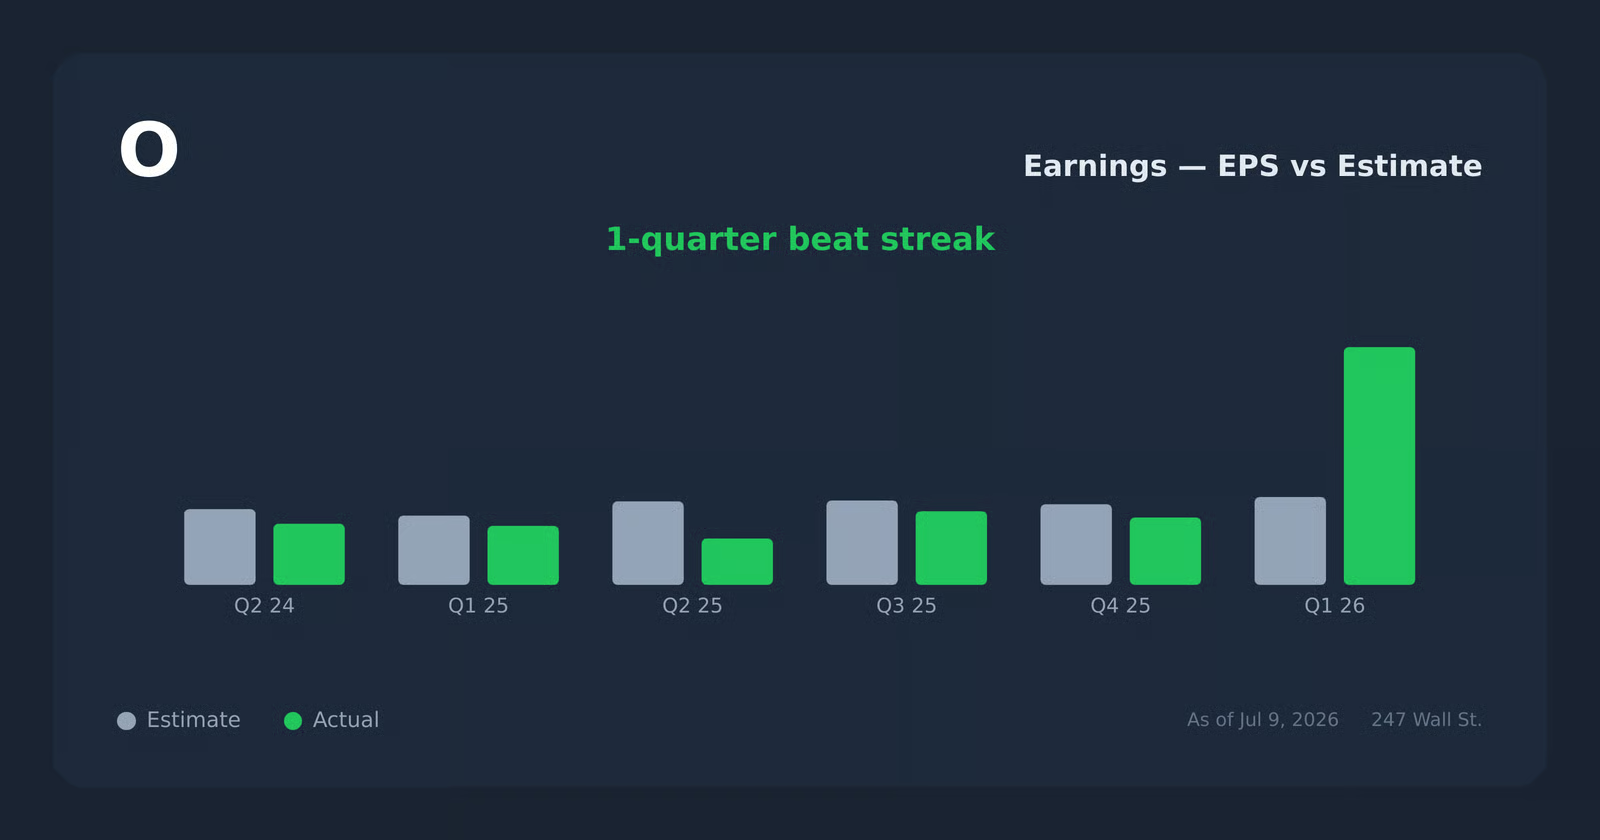
| EPS | 0.33 | 1.40 | 1.21 | 0.03 | 0.15 | 0.78 | 0.05 | -0.09 | 0.85 | -0.88 | -1.21 | 0.27 |
| Free Cash Flow | (1.90B) | 471.53M | (292.20M) | 141.92M | (543.41M) | 2.65B | (1.74B) | 356.18M | 1.18B | 380.38M | 1.69B | 959.12M |
| FCF / Share | -2.63 | 0.68 | -0.47 | 0.23 | -0.93 | 4.65 | -3.37 | 0.71 | 2.36 | 0.76 | 3.41 | 1.94 |
| Operating CF | (1.40B) | 644.34M | 24.09M | 180.74M | (156.27M) | 2.81B | (1.67B) | 477.07M | 1.70B | 378.52M | 1.87B | 1.14B |
| Total Assets | 138.54B | 135.61B | 125.86B | 112.14B | 105.12B | 103.56B | 101.52B | 93.67B | 91.48B | 93.23B | 89.65B | 89.33B |
| Total Debt | 116.91B | 111.86B | 107.02B | 95.76B | 88.63B | 89.61B | 86.13B | 17.58B | 15.45B | 77.55B | 11.27B | 10.78B |
| Cash & Equiv | 1.91B | 2.04B | 320.35M | 267.08M | 296.94M | 285.15M | 324.22M | 320.58M | 298.31M | 1.41B | 374.62M | 1.24B |
| Book Value | 16.27B | 16.09B | 14.91B | 13.38B | 12.99B | 12.61B | 12.44B | 11.18B | 11.41B | 11.26B | 10.56B | 11.78B |
| Return on Equity | 0.02 | 0.06 | 0.06 | 0.00 | 0.01 | 0.04 | 0.01 | -0.00 | 0.04 | -0.04 | -0.05 | 0.01 |