NEM
Newmont Corporation
$95.29
+0.48
(+0.51%)
Mkt Cap
101.73B
Volume
3,495,930
52W Range
55.37-134.88
Sector
Basic Materials
Beta
0.48
EPS (TTM)
7.74
P/E Ratio
12.31
Revenue (TTM)
24.41B
Rev Growth (5Y)
+14.1%
EPS Growth (5Y)
+12.7%
AlphaVal · Fair Value
What we estimate one share is worth
$70.69
Overvalued
moderate signal
34.8% above fair value
Modeled from cash flows & growth.
AlphaQuality · Grade
How strong & durable the business is
B
Other Commodity Producers
71.1 / 100 composite
A commodity producer — graded A–F vs. similar companies.
Company Description
Newmont Corporation is primarily involved in the mining and exploration of gold resources. Additionally, the company undertakes prospecting for other base and precious metals, including copper, silver, zinc, and lead. Its operations and assets are geographically widespread, located across various countries such as the United States, Canada, Mexico, the Dominican Republic, Peru, Suriname, Argentina, Chile, Australia, and Ghana. As of the close of 2021 (December 31st), Newmont reported substantial proven and probable gold reserves, totaling 92.8 million ounces, and managed a vast land portfolio covering 62,800 square kilometers. Founded in 1916, the company's corporate headquarters are situated in Denver, Colorado.
Track Record
Showing latest 4 periods • Swipe for more
| Metric | 2025 | 2024 | 2023 | 2022 | 2021 | 2020 | 2019 | 2018 | 2017 | 2016 | 2015 | 2014 |
|---|---|---|---|---|---|---|---|---|---|---|---|---|
| Revenue | 22.10B | 18.56B | 11.78B | 11.95B | 12.19B | 11.42B | 9.73B | 7.26B | 7.36B | 6.69B | 6.08B | 7.32B |
| Net Income | 7.08B | 3.35B | (2.52B) | (459.00M) | 1.17B | 2.83B | 2.81B | 341.00M | (114.00M) | (27.00M) | 220.00M | 508.00M |
| EPS | 6.41 | 2.86 | -3.00 | -0.58 | 1.46 | 3.52 | 3.82 | 0.64 | -0.21 | -0.05 | 0.43 | 1.02 |
| Free Cash Flow | 7.30B | 2.96B | 97.00M | 1.09B | 2.63B | 3.58B | 1.40B | 795.00M | 1.26B | 1.65B | 744.00M | 328.00M |
| FCF / Share | 6.60 | 2.58 | 0.12 | 1.37 | 3.29 | 4.45 | 1.91 | 1.49 | 2.36 | 3.12 | 1.45 | 0.66 |
| Operating CF | 10.33B | 6.36B | 2.76B | 3.22B | 4.28B | 4.88B | 2.87B | 1.83B | 2.12B | 2.79B | 2.15B | 1.44B |
| Total Assets | 57.12B | 56.35B | 55.51B | 38.48B | 40.56B | 41.37B | 39.97B | 20.71B | 20.65B | 21.03B | 25.18B | 24.92B |
| Total Debt | 5.71B | 8.97B | 9.44B | 6.13B | 6.30B | 6.70B | 6.91B | 4.26B | 4.07B | 4.62B | 6.00B | 6.65B |
| Cash & Equiv | 7.65B | 3.62B | 3.00B | 2.88B | 4.99B | 5.54B | 2.24B | 3.40B | 3.26B | 2.76B | 2.78B | 2.40B |
| Book Value | 33.87B | 29.93B | 29.03B | 19.35B | 22.02B | 23.01B | 21.42B | 10.50B | 10.54B | 10.72B | 11.35B | 10.27B |
| Return on Equity | 0.21 | 0.11 | -0.09 | -0.02 | 0.05 | 0.12 | 0.13 | 0.03 | -0.01 | -0.00 | 0.02 | 0.05 |
| Metric | Q1 2026 | Q4 2025 | Q3 2025 | Q2 2025 | Q1 2025 | Q4 2024 | Q3 2024 | Q2 2024 | Q1 2024 | Q4 2023 | Q3 2023 | Q2 2023 |
|---|---|---|---|---|---|---|---|---|---|---|---|---|
| Revenue | 7.18B | 6.57B | 5.38B | 5.28B | 4.87B | 5.72B | 4.60B | 4.31B | 4.00B | 3.92B | 2.49B | 2.71B |
| Net Income | 3.26B | 1.30B | 1.83B | 2.06B | 1.89B | 1.40B | 922.00M | 853.00M | 166.00M | (3.15B) | 158.00M | 155.00M |
| EPS | 3.01 | 1.20 | 1.67 | 1.86 | 1.68 | 1.24 | 0.80 | 0.74 | 0.14 | -3.22 | 0.20 | 0.20 |
| Free Cash Flow | 3.14B | 5.85B | 1.57B | 1.71B | 1.21B | 1.64B | 771.00M | 628.00M | (74.00M) | (304.00M) | 399.00M | 47.00M |
| FCF / Share | 2.90 | 5.29 | 1.43 | 1.54 | 1.07 | 1.43 | 0.67 | 0.54 | -0.06 | -0.31 | 0.50 | 0.06 |
| Operating CF | 3.79B | 3.62B | 2.30B | 2.38B | 2.03B | 2.51B | 1.65B | 1.43B | 776.00M | 616.00M | 1.00B | 663.00M |
| Total Assets | 57.67B | 57.12B | 54.69B | 55.16B | 55.52B | 56.35B | 56.17B | 55.68B | 55.34B | 55.51B | 38.08B | 38.13B |
| Total Debt | 5.53B | 5.71B | 5.65B | 7.61B | 7.99B | 8.97B | 9.10B | 9.22B | 9.47B | 9.44B | 6.09B | 6.11B |
| Cash & Equiv | 8.78B | 7.65B | 5.64B | 6.18B | 4.70B | 3.62B | 3.02B | 2.61B | 2.34B | 3.00B | 3.19B | 2.83B |
| Book Value | 34.93B | 33.87B | 33.23B | 32.11B | 31.25B | 29.93B | 29.71B | 29.38B | 28.89B | 29.03B | 19.07B | 19.23B |
| Return on Equity | 0.09 | 0.04 | 0.06 | 0.06 | 0.06 | 0.05 | 0.03 | 0.03 | 0.01 | -0.11 | 0.01 | 0.01 |
NEM News
Goldman Sachs Physical Gold ETF vs VanEck Gold Miners ETF. Is Bullion or Miners the Better Way to Invest in Gold in 2026?

Newmont: Buy The Dip

Newmont Corporation (NEM) Outperforms Broader Market: What You Need to Know

Newmont Corp (NEM) Shares Fall 3.2% -- GF Value Says Still Overvalued

Newmont: Another Bite At The Apple

Newmont: A Cheap Gold Major, But Not My Top Pick

Newmont Corporation (NEM) Exceeds Market Returns: Some Facts to Consider
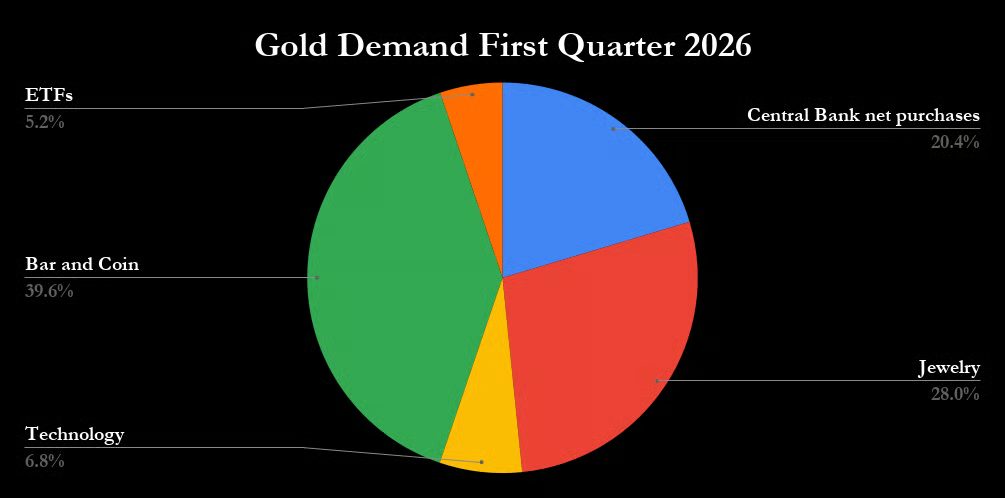
Gold Was Volatile in the First Half of 2026. Here's How to Invest in Gold for the Rest of the Year.

Why Newmont Stock Collapsed in June, And What to Expect Next

AngloGold Ashanti vs. Newmont: Which Gold Mining Stock Is a Better Buy in 2026?